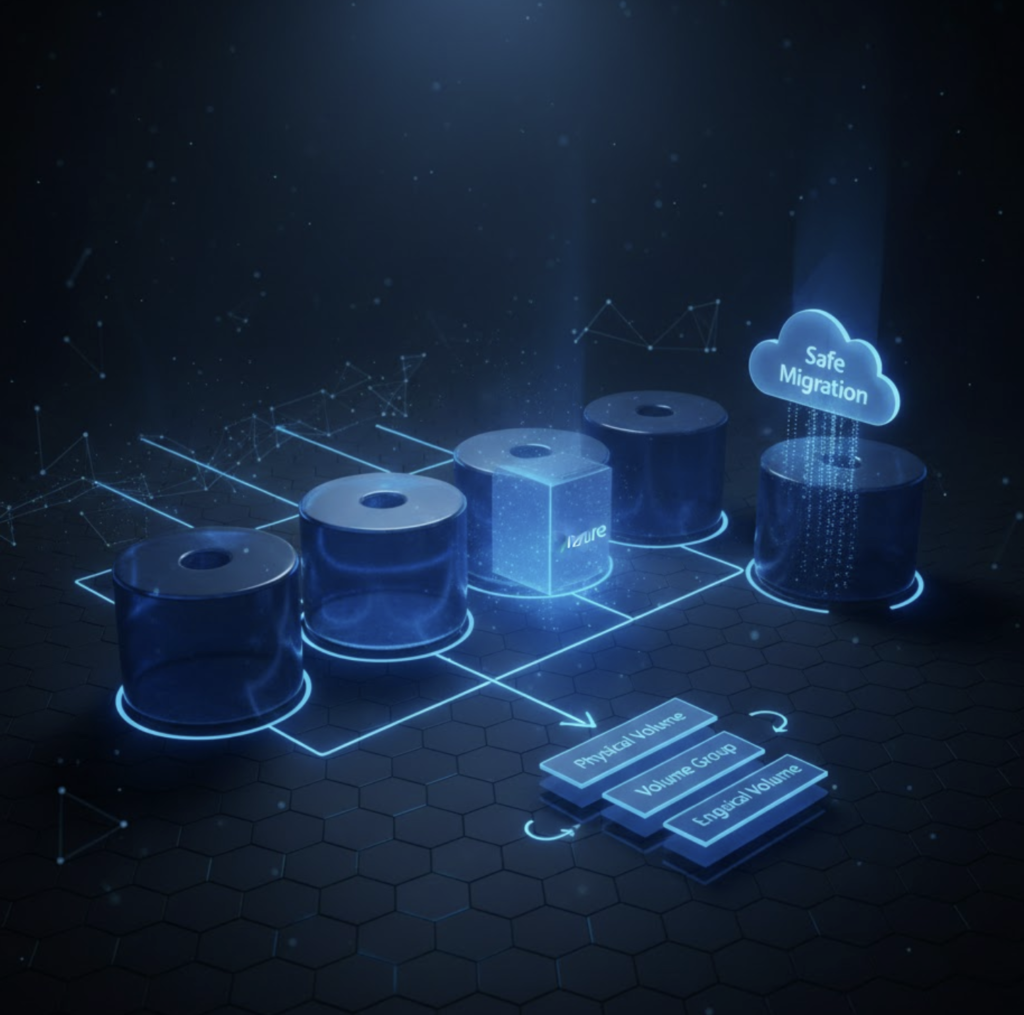
How to Safely Remove an LVM Disk from an Azure/AWS VM
Managing storage in production environments requires precision, especially when working with LVM-backed filesystems on cloud infrastructure. This guide documents a production-safe procedure to: This process ensures zero data loss and controlled disk decommissioning. Step 1: Stop the Application Before performing any filesystem shrink or LVM modification, stop the service using the volume. systemctl stop cassandra.service […]
How to Safely Remove an LVM Disk from an Azure/AWS VM Read More »