Monitoring MySQL databases is essential for ensuring performance, availability, and reliability in production environments. Without proper monitoring, issues such as high query latency, connection exhaustion, replication lag, or disk bottlenecks can go unnoticed until they impact applications.
In this blog, you’ll learn how to monitor MySQL using MySQL Exporter, Prometheus, and Grafana, starting from setup and ending with real-time dashboards and actionable insights.
What Is MySQL Exporter, Prometheus, and Grafana?
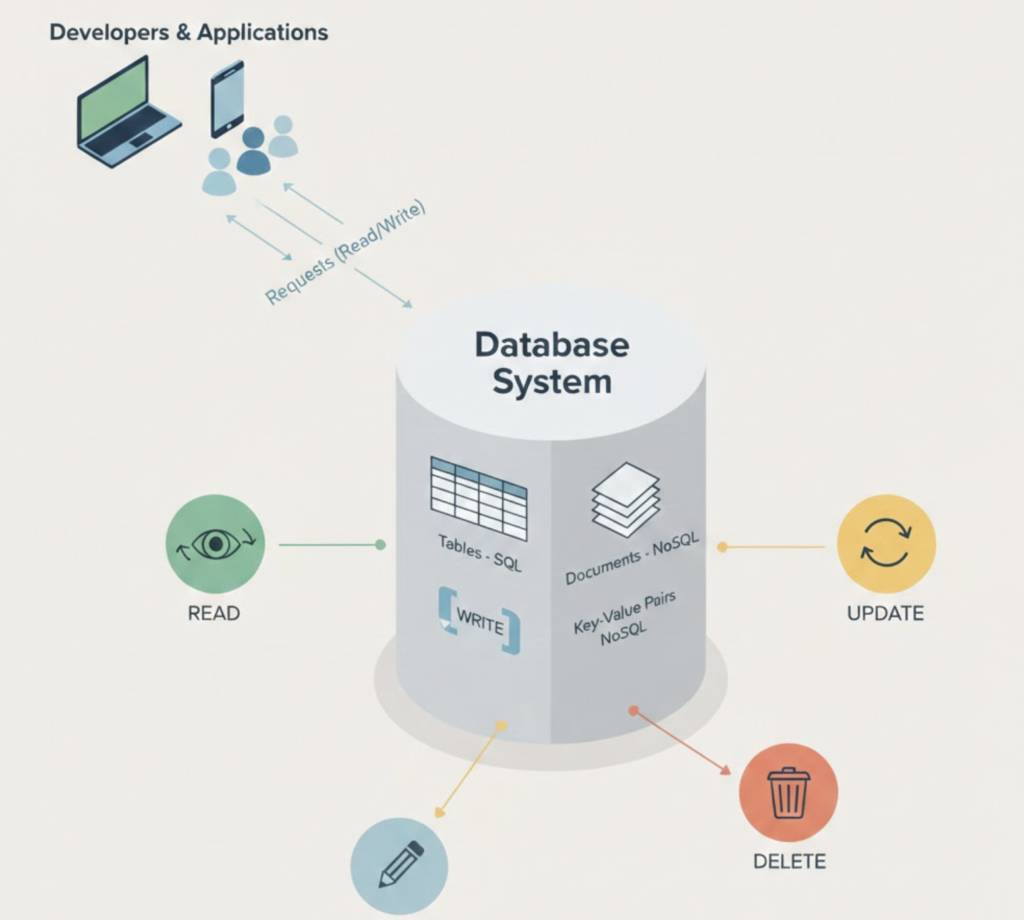
MySQL
MySQL is one of the most widely used open-source relational databases, powering web applications, SaaS platforms, and enterprise systems.
Prometheus
Prometheus is an open-source monitoring and alerting system that collects metrics using a pull-based model and stores time-series data efficiently.
Grafana
Grafana is a powerful visualization and observability platform used to build dashboards, analyze metrics, and create alerts.
MySQL Exporter
MySQL Exporter exposes MySQL internal metrics (connections, queries, InnoDB stats, replication status) in Prometheus format.
Why Monitor MySQL with Prometheus and Grafana?
✔ Real-time visibility into database performance
✔ Early detection of slow queries and connection spikes
✔ Monitor replication and availability
✔ Capacity planning and trend analysis
✔ Production-ready observability stack
MySQL Monitoring Architecture

Data Flow
MySQL → MySQL Exporter → Prometheus → Grafana
System Requirements
| Component | Requirement |
|---|---|
| OS | RHEL 8/9 or Ubuntu |
| MySQL | 5.7 / 8.0 |
| RAM | Minimum 2 GB |
| Ports | 9104, 9090, 3000 |
| Access | MySQL user with monitoring privileges |
Step 1: Create MySQL Monitoring User
Login to MySQL:
mysql -u root -p
Create exporter user:
CREATE USER 'exporter'@'localhost' IDENTIFIED BY 'StrongPassword';
GRANT PROCESS, REPLICATION CLIENT, SELECT ON *.* TO 'exporter'@'localhost';
FLUSH PRIVILEGES;
This user has read-only permissions, making it safe for production.
Step 2: Install MySQL Exporter
cd /opt
sudo wget https://github.com/prometheus/mysqld_exporter/releases/download/v0.15.1/mysqld_exporter-0.15.1.linux-amd64.tar.gz
Extract:
sudo tar -xvf mysqld_exporter-0.15.1.linux-amd64.tar.gz
sudo mv mysqld_exporter-0.15.1.linux-amd64 mysqld_exporter
Configure Exporter Credentials
sudo nano /etc/.my.cnf
[client]
user=exporter
password=StrongPassword
Secure file:
sudo chmod 600 /etc/.my.cnf
Create MySQL Exporter Service
sudo nano /etc/systemd/system/mysqld_exporter.service
[Unit]
Description=MySQL Exporter
After=network.target

[Service]
User=root
ExecStart=/opt/mysqld_exporter/mysqld_exporter \
  --config.my-cnf=/etc/.my.cnf

[Install]
WantedBy=multi-user.target
Start exporter:
sudo systemctl daemon-reload
sudo systemctl enable mysqld_exporter
sudo systemctl start mysqld_exporter
Verify:
curl http://localhost:9104/metrics
Step 3: Configure Prometheus for MySQL Metrics
Edit Prometheus config:
sudo nano /opt/prometheus/prometheus.yml
Add:
  - job_name: "mysql"
    static_configs:
      - targets: ["localhost:9104"]
Restart Prometheus:
sudo systemctl restart prometheus
Verify target:
http://<server-ip>:9090/targets
Step 4: Install and Access Grafana
sudo dnf install -y https://dl.grafana.com/oss/release/grafana-10.2.3-1.x86_64.rpm
Start Grafana:
sudo systemctl enable grafana-server
sudo systemctl start grafana-server
Access:
http://<server-ip>:3000
Step 5: Add Prometheus Data Source in Grafana
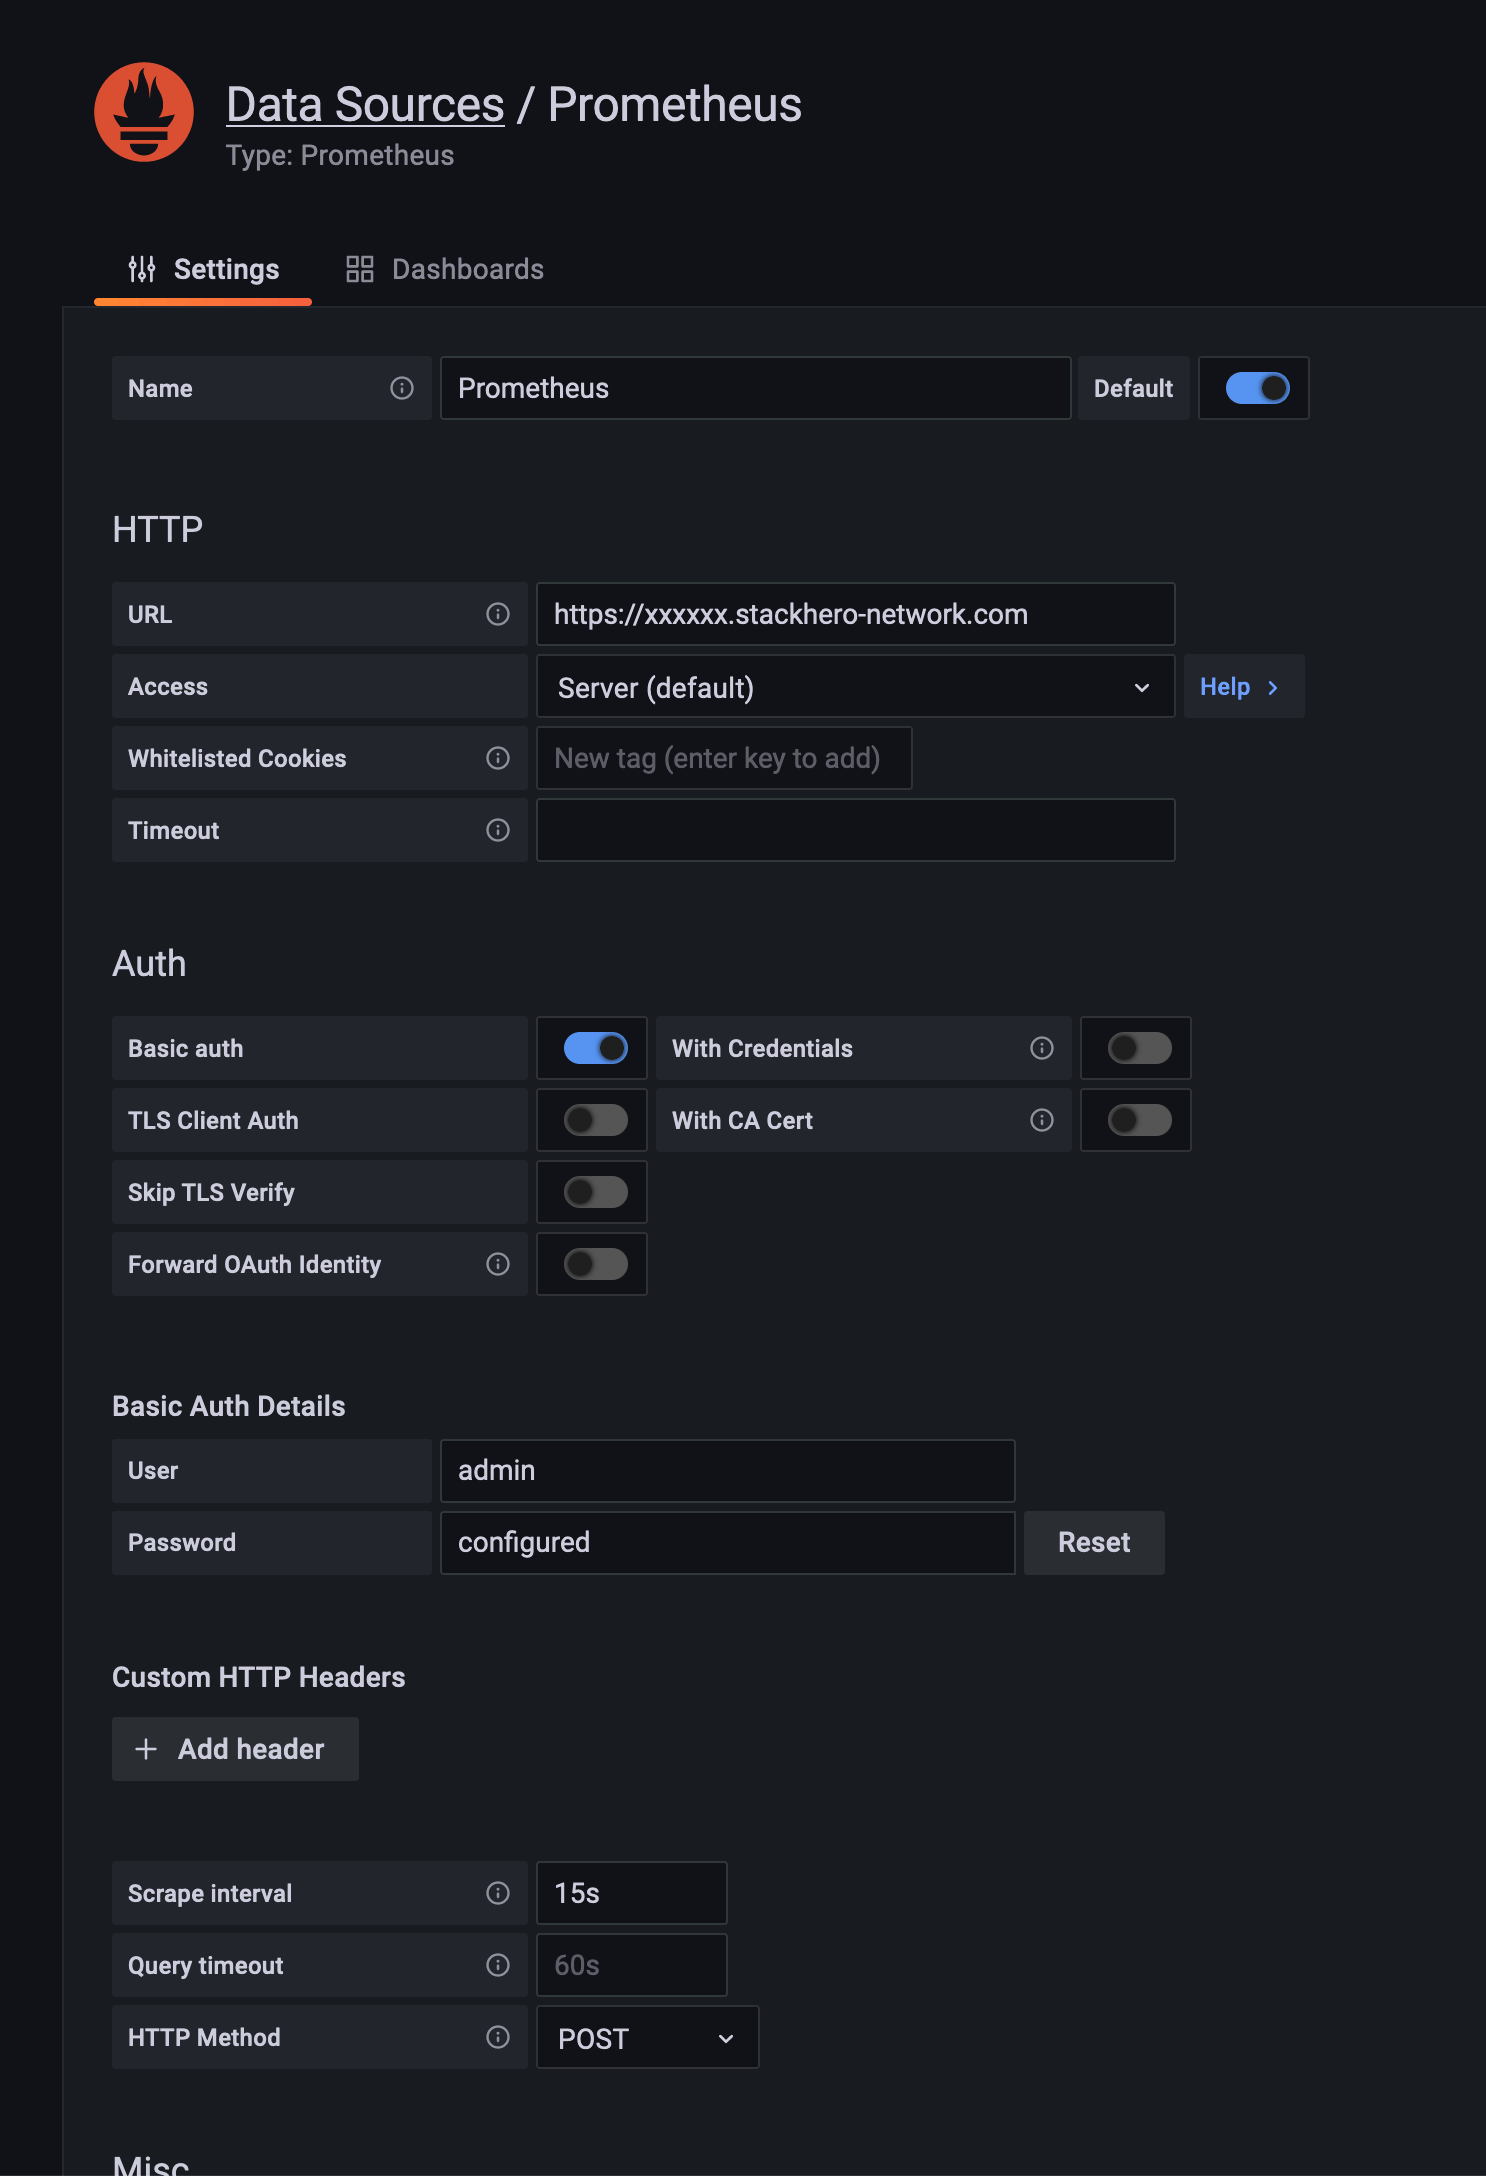
Steps:
- Grafana → ⚙ Settings → Data Sources
- Add Prometheus
- URL:
http://localhost:9090 - Save & Test
Step 6: Import MySQL Grafana Dashboard
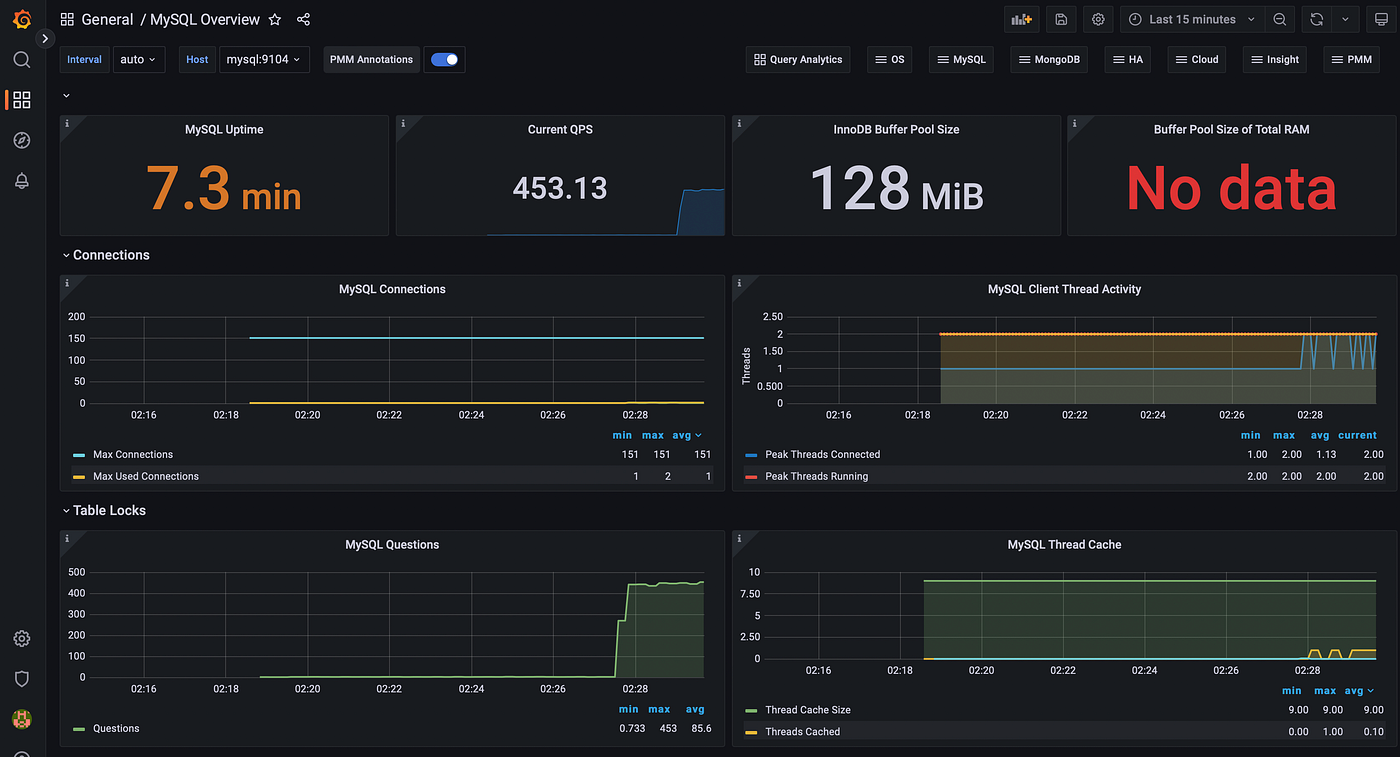
Recommended dashboard:
Dashboard ID: 7362
Steps:
- Grafana → Dashboards → Import
- Enter 7362
- Select Prometheus → Import
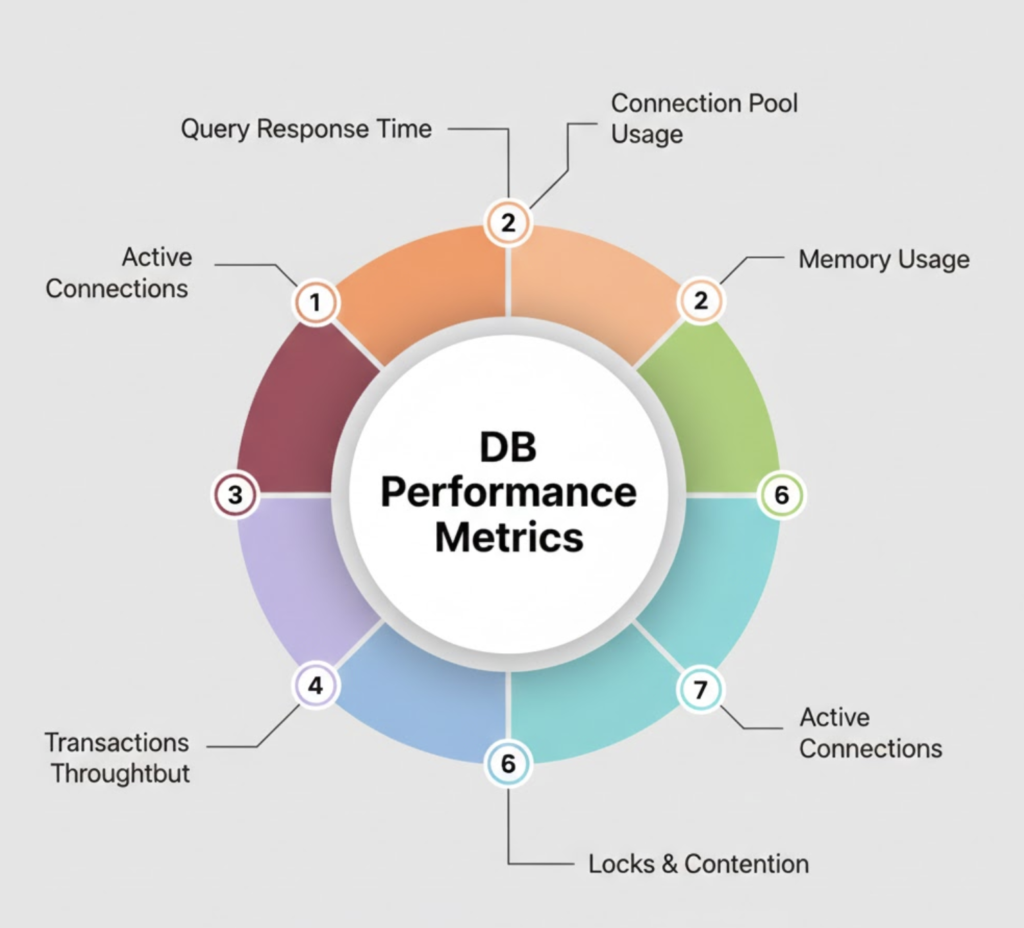
Key MySQL Metrics You Can Monitor
✔ Active & running connections
✔ Queries per second (QPS)
✔ Slow queries
✔ InnoDB buffer pool usage
✔ Disk I/O and latency
✔ Replication status & lag
Production Best Practices
✔ Use a dedicated MySQL monitoring user
✔ Enable TLS for MySQL and Grafana
✔ Monitor replication nodes individually
✔ Set alerts for connection saturation
✔ Track long-term trends for capacity planning
Common Issues and Fixes
| Issue | Solution |
|---|---|
| No MySQL data in Grafana | Check Prometheus target |
| Exporter auth failure | Verify .my.cnf |
| Dashboard empty | Select correct data source |
| High exporter CPU | Reduce scrape interval |
MySQL Monitoring with Grafana vs Native Tools
| Feature | Prometheus + Grafana | Native MySQL |
|---|---|---|
| Visualization | Advanced | Limited |
| Alerts | Yes | No |
| Historical data | Yes | Limited |
| Scalability | High | Low |
Conclusion
Monitoring MySQL with MySQL Exporter, Prometheus, and Grafana provides deep visibility into database performance and health. This setup helps DevOps teams detect issues early, optimize queries, and maintain high availability in production environments.