
Logs are the backbone of troubleshooting, security auditing, and observability. Traditional log management systems can be heavy, expensive, and complex.
Grafana Loki, combined with Promtail, offers a lightweight, scalable, and cost-effective log aggregation solution, tightly integrated with Grafana dashboards.
In this blog, you’ll learn how to set up Grafana Loki with Promtail on a Linux server, starting from scratch and ending with powerful log visualization and querying in Grafana.
What Is Grafana Loki, Promtail, and Grafana?
Grafana
Grafana is an open-source observability and visualization platform used for metrics, logs, and traces.
Loki
Loki is a log aggregation system inspired by Prometheus, designed to store logs efficiently using labels instead of full indexing.
Promtail
Promtail is a log shipping agent that collects logs from Linux systems and sends them to Loki.
Why Use Grafana Loki for Log Analysis?
✔ Lightweight & cost-efficient
✔ No full-text indexing (low storage cost)
✔ Native Grafana integration
✔ Kubernetes & VM friendly
✔ Simple label-based queries
Grafana Loki Architecture Overview
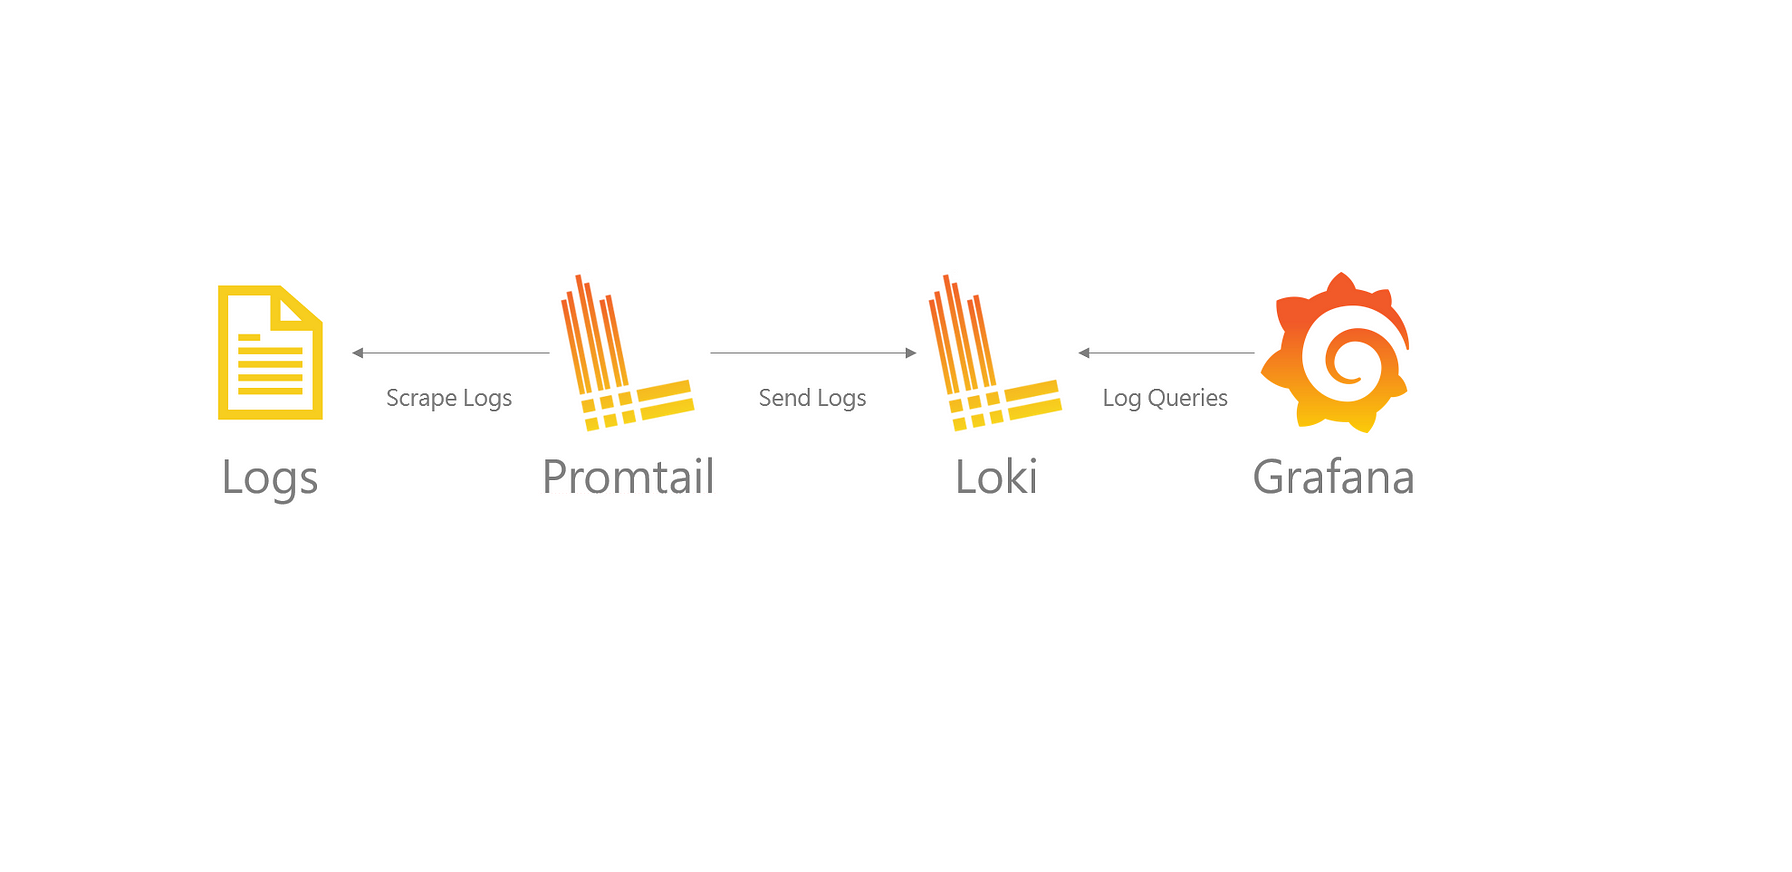
Log Flow
Linux Server Logs → Promtail → Loki → Grafana
System Requirements
| Component | Requirement |
|---|---|
| OS | Ubuntu / RHEL |
| RAM | Minimum 2 GB |
| CPU | 1 Core |
| Ports | 3100, 3000 |
| Access | sudo or root |
Step 1: Install Grafana
sudo dnf install -y https://dl.grafana.com/oss/release/grafana-10.2.3-1.x86_64.rpm
Start Grafana:
sudo systemctl enable grafana-server
sudo systemctl start grafana-server
Access:
http://<server-ip>:3000
Step 2: Install Loki
cd /opt
sudo wget https://github.com/grafana/loki/releases/download/v2.9.4/loki-linux-amd64.zip
sudo unzip loki-linux-amd64.zip
sudo mv loki-linux-amd64 loki
sudo chmod +x loki
Configure Loki
sudo nano /etc/loki-config.yml
auth_enabled: false

server:
  http_listen_port: 3100

common:
  path_prefix: /var/loki
  storage:
    filesystem:
      chunks_directory: /var/loki/chunks
      rules_directory: /var/loki/rules
  replication_factor: 1
  ring:
    kvstore:
      store: inmemory

schema_config:
  configs:
    - from: 2023-01-01
      store: tsdb
      object_store: filesystem
      schema: v13
      index:
        prefix: index_
        period: 24h
Create Loki Service
sudo nano /etc/systemd/system/loki.service
[Unit]
Description=Grafana Loki
After=network.target

[Service]
User=root
ExecStart=/opt/loki -config.file=/etc/loki-config.yml

[Install]
WantedBy=multi-user.target
Start Loki:
sudo systemctl daemon-reload
sudo systemctl enable loki
sudo systemctl start loki
Verify:
curl http://localhost:3100/ready
Step 3: Install Promtail
cd /opt
sudo wget https://github.com/grafana/loki/releases/download/v2.9.4/promtail-linux-amd64.zip
sudo unzip promtail-linux-amd64.zip
sudo mv promtail-linux-amd64 promtail
sudo chmod +x promtail
Configure Promtail
sudo nano /etc/promtail-config.yml
server:
  http_listen_port: 9080
  grpc_listen_port: 0

positions:
  filename: /var/log/positions.yaml

clients:
  - url: http://localhost:3100/loki/api/v1/push

scrape_configs:
  - job_name: system-logs
    static_configs:
      - targets:
          - localhost
        labels:
          job: varlogs
          host: linux-server
          __path__: /var/log/*.log
Create Promtail Service
sudo nano /etc/systemd/system/promtail.service
[Unit]
Description=Promtail Log Agent
After=network.target

[Service]
User=root
ExecStart=/opt/promtail -config.file=/etc/promtail-config.yml

[Install]
WantedBy=multi-user.target
Start Promtail:
sudo systemctl daemon-reload
sudo systemctl enable promtail
sudo systemctl start promtail
Step 4: Add Loki as Data Source in Grafana
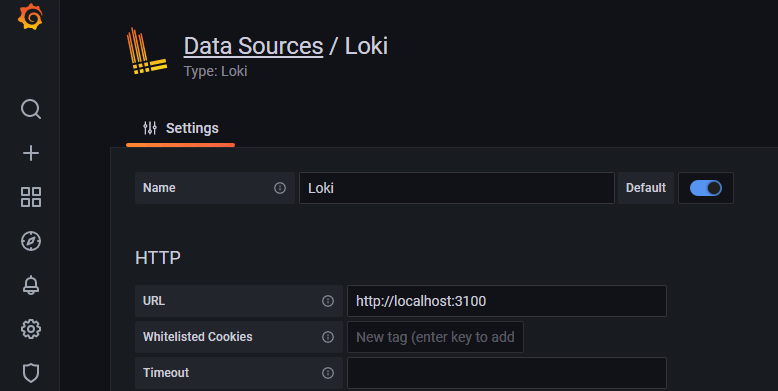
Steps:
- Grafana → ⚙ Settings → Data Sources
- Add Loki
- URL:
http://localhost:3100 - Save & Test
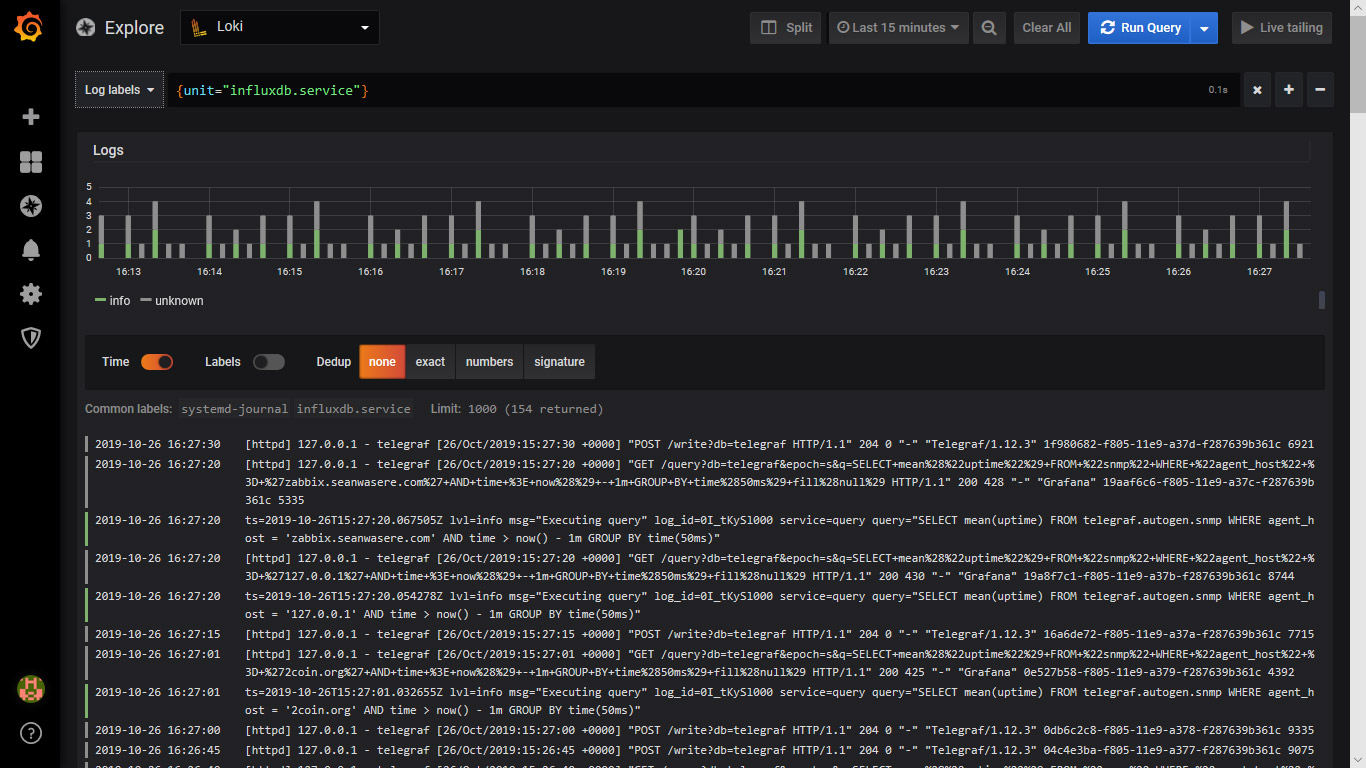
Step 5: Query Logs in Grafana (LogQL)
Basic LogQL Queries
Show all logs:
{job="varlogs"}
Filter errors:
{job="varlogs"} |= "error"
Logs from specific file:
{job="varlogs"} |= "sshd"
Use Cases for Loki Log Analysis
✔ System logs (/var/log/messages)
✔ Authentication logs (/var/log/secure)
✔ Application logs
✔ Kubernetes pod logs
✔ Security incident investigation
Production Best Practices
✔ Enable log retention policies
✔ Secure Loki with reverse proxy
✔ Use labels wisely (avoid high cardinality)
✔ Separate Loki storage volume
✔ Integrate with Grafana alerts
Common Issues and Fixes
| Issue | Solution |
|---|---|
| No logs in Grafana | Check Promtail service |
| Loki not ready | Check port 3100 |
| High disk usage | Set retention |
| Empty queries | Verify labels |
Loki vs ELK (Quick Comparison)
| Feature | Loki | ELK |
|---|---|---|
| Indexing | Metadata only | Full text |
| Storage cost | Low | High |
| Setup | Simple | Complex |
| Grafana integration | Native | Plugin-based |
Conclusion
Grafana Loki with Promtail provides a modern, efficient, and scalable log analysis solution for Linux servers. It eliminates the complexity of traditional logging stacks while delivering powerful querying and visualization directly inside Grafana.
This setup is ideal for DevOps teams, SREs, and system administrators seeking cost-effective centralized logging.