Learn practical database debugging techniques to troubleshoot performance issues, errors, and operational failures.
What Is Database Debugging?
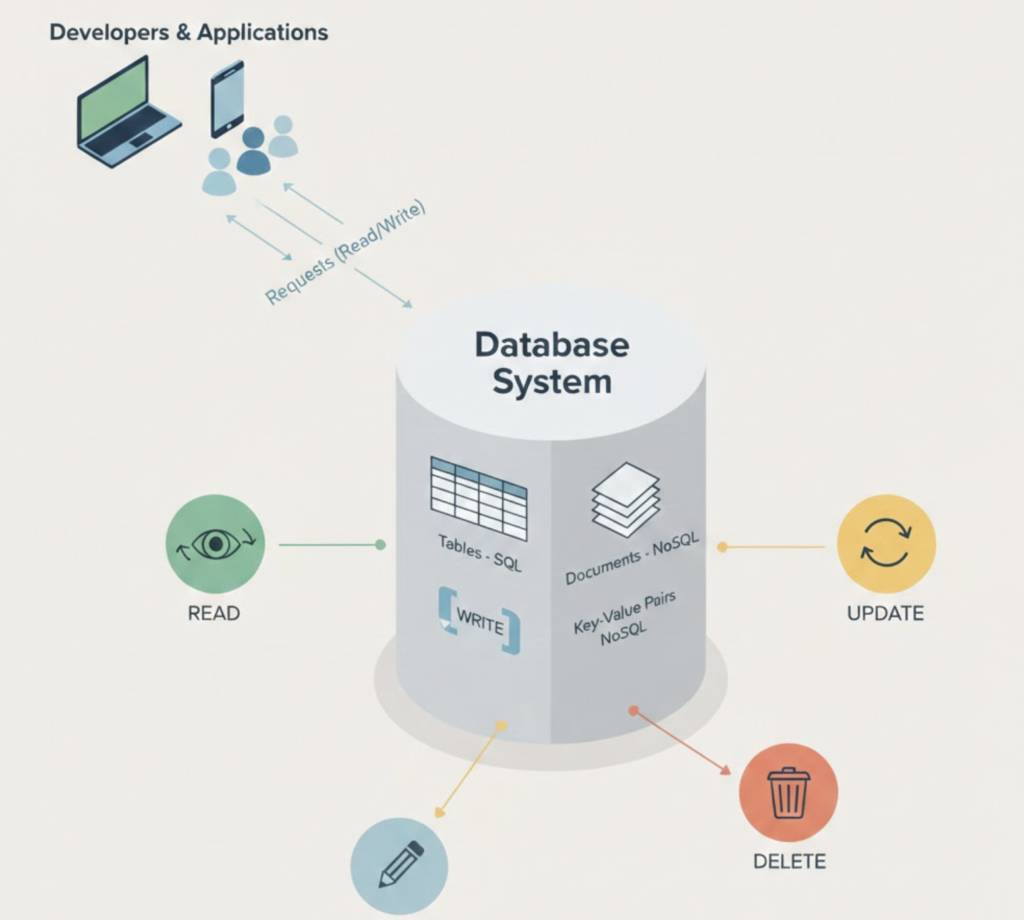
Database debugging is the process of identifying and resolving issues that affect database performance, availability, or correctness. These issues may arise from configuration errors, query inefficiencies, resource exhaustion, or infrastructure problems.
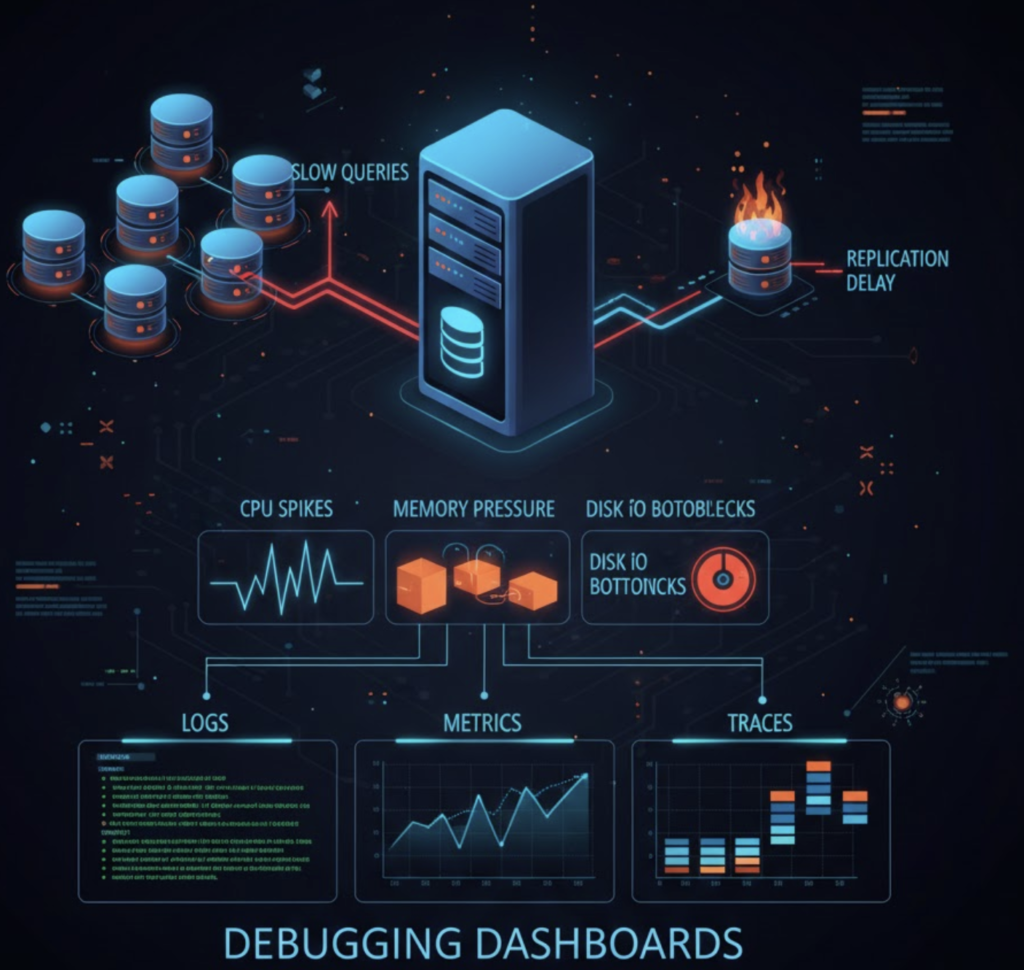
Effective debugging relies on logs, metrics, and structured analysis.
Common Symptoms That Require Debugging
- Slow or failing queries
- Connection timeouts
- Replication lag
- High CPU or memory usage
- Disk space exhaustion
Key Debugging Techniques
Analyze Database Logs
Logs provide critical insight into errors, slow queries, and startup failures.
Examples:
- PostgreSQL logs
- MongoDB diagnostic logs
- MySQL slow query logs
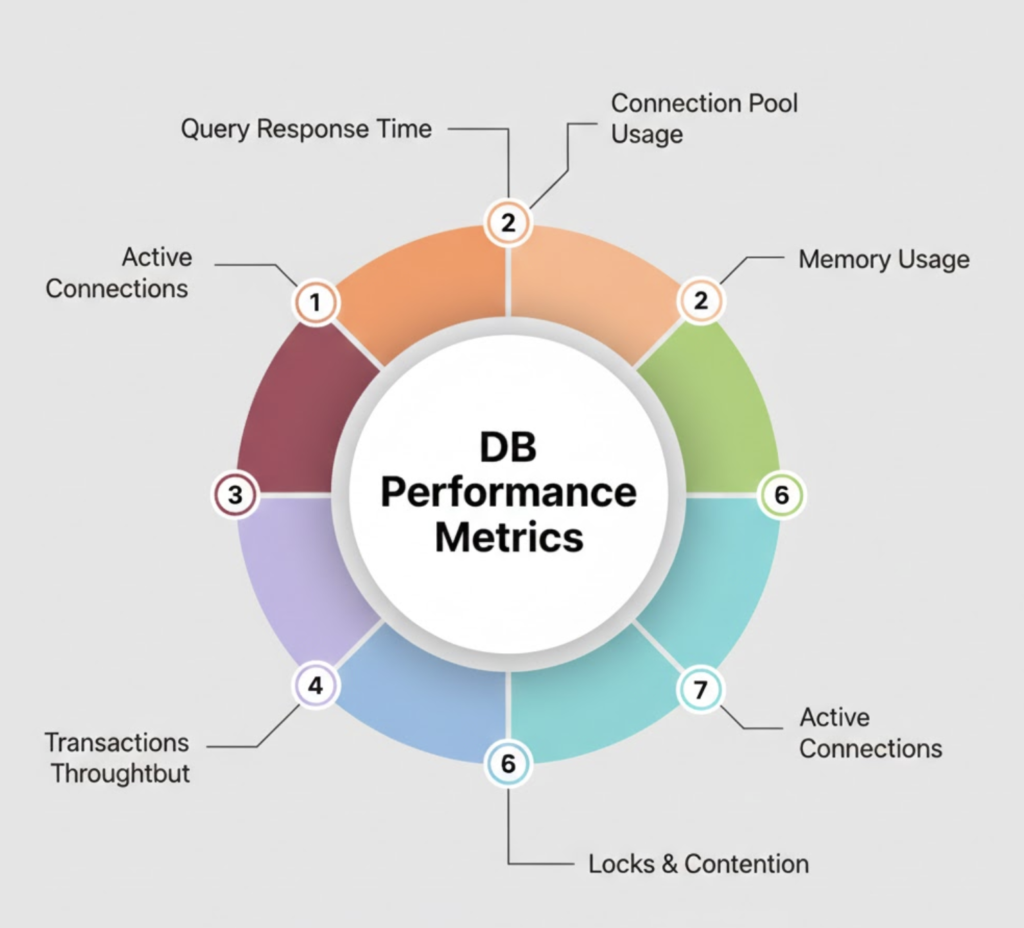
Monitor Performance Metrics
Track CPU, memory, disk I/O, and network usage to identify bottlenecks.
Query Analysis
Use explain plans and profiling tools to understand query execution paths and indexing issues.
Replication Health Checks
Monitor replica status, lag, and synchronization errors to prevent data inconsistency.
Structured Troubleshooting Approach
- Identify symptoms
- Narrow down affected components
- Review recent changes
- Analyze logs and metrics
- Apply fixes incrementally
- Validate and monitor
Best Practices for Effective Debugging
- Enable detailed logging in production-safe modes
- Set up alerts for critical thresholds
- Maintain runbooks for common issues
- Automate health checks
- Perform root cause analysis after incidents
Conclusion
Database debugging is a critical operational skill. A systematic approach backed by monitoring and logging enables faster resolution and improves system reliability.