Monitoring

How to Monitor MongoDB with Prometheus and Grafana

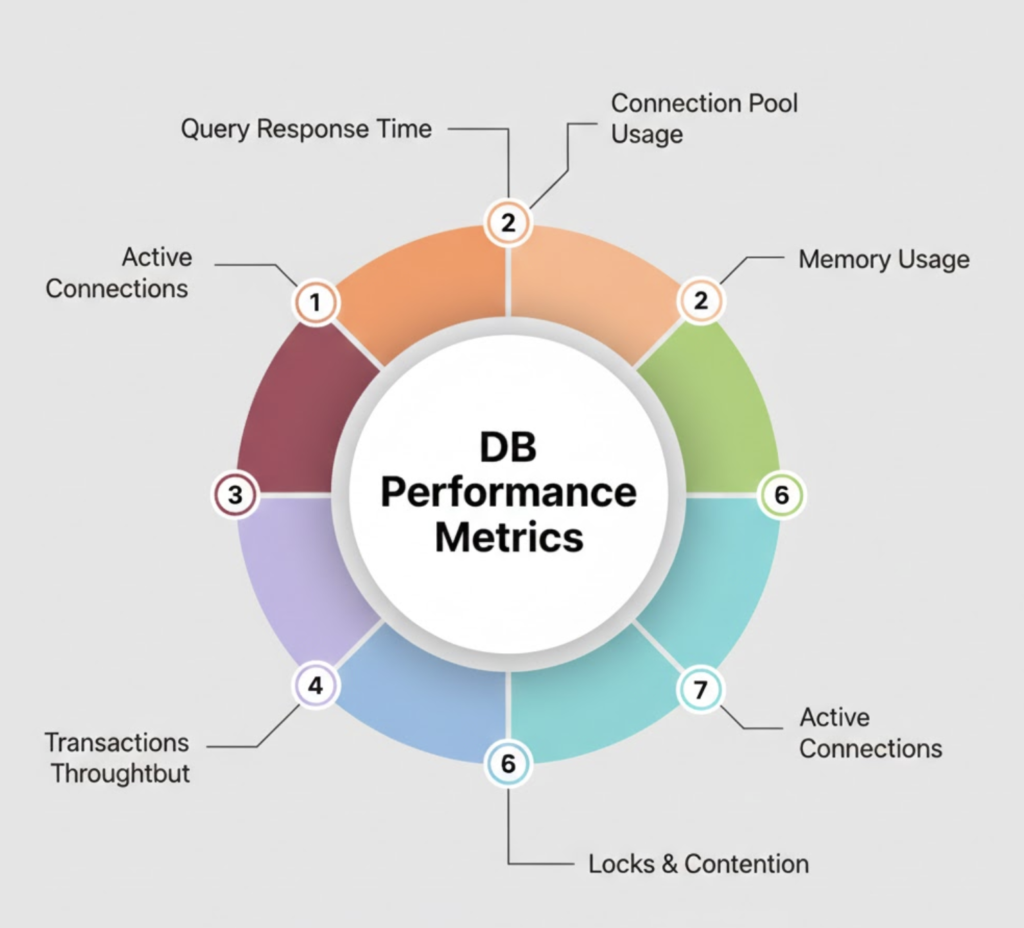
Monitoring MongoDB is critical for maintaining database performance, availability, and reliability in production environments. Metrics such as connections, memory usage, query performance, replication lag, and disk I/O help teams detect issues before they impact applications. In this blog, you’ll learn how to monitor MongoDB using MongoDB Exporter and Grafana, starting from installation and ending with […]

How to Monitor MongoDB with Prometheus and Grafana Read More »

How to Monitor Redis with Prometheus, Grafana, and Redis Exporter

Redis is widely used as an in-memory data store, cache, and message broker for high-performance applications. Because Redis often sits on the critical path of application performance, even small issues like memory saturation, slow commands, or connection spikes can lead to serious outages. In this blog, you’ll learn how to monitor Redis using Redis Exporter,

How to Monitor Redis with Prometheus, Grafana, and Redis Exporter Read More »

How to Monitor MySQL with Prometheus, Grafana, and MySQL Exporter

Monitoring MySQL databases is essential for ensuring performance, availability, and reliability in production environments. Without proper monitoring, issues such as high query latency, connection exhaustion, replication lag, or disk bottlenecks can go unnoticed until they impact applications. In this blog, you’ll learn how to monitor MySQL using MySQL Exporter, Prometheus, and Grafana, starting from setup

How to Monitor MySQL with Prometheus, Grafana, and MySQL Exporter Read More »

How to Centralize Linux Logs Using Grafana Loki and Promtail

Logs are the backbone of troubleshooting, security auditing, and observability. Traditional log management systems can be heavy, expensive, and complex. Grafana Loki, combined with Promtail, offers a lightweight, scalable, and cost-effective log aggregation solution, tightly integrated with Grafana dashboards. In this blog, you’ll learn how to set up Grafana Loki with Promtail on a Linux

How to Centralize Linux Logs Using Grafana Loki and Promtail Read More »

How to Set Up ELK Stack on Ubuntu Server for Log Monitoring and Visualization

The ELK Stack is a powerful centralized logging and visualization solution used by DevOps engineers, system administrators, and SRE teams to collect, search, analyze, and visualize logs in real time. ELK = Server Logs → Filebeat → Logstash → Elasticsearch → Kibanayou’ll learn how to install and configure ELK Stack on Ubuntu Server from scratch,

How to Set Up ELK Stack on Ubuntu Server for Log Monitoring and Visualization Read More »

Database Performance Explained: Monitoring, Optimization, and Best Practices

Learn how to monitor database performance, identify bottlenecks, and apply best practices for reliable database operations. Why Database Performance Matters Database performance directly impacts application speed, user experience, and infrastructure costs. Even well-designed applications can fail if the database becomes a bottleneck. Performance management requires continuous monitoring and tuning, not one-time fixes. Key Database Performance

Database Performance Explained: Monitoring, Optimization, and Best Practices Read More »