Redis is widely used as an in-memory data store, cache, and message broker for high-performance applications. Because Redis often sits on the critical path of application performance, even small issues like memory saturation, slow commands, or connection spikes can lead to serious outages.
In this blog, you’ll learn how to monitor Redis using Redis Exporter, Prometheus, and Grafana, starting from setup and ending with real-time dashboards and actionable insights.
What Are Redis Exporter, Prometheus, and Grafana?
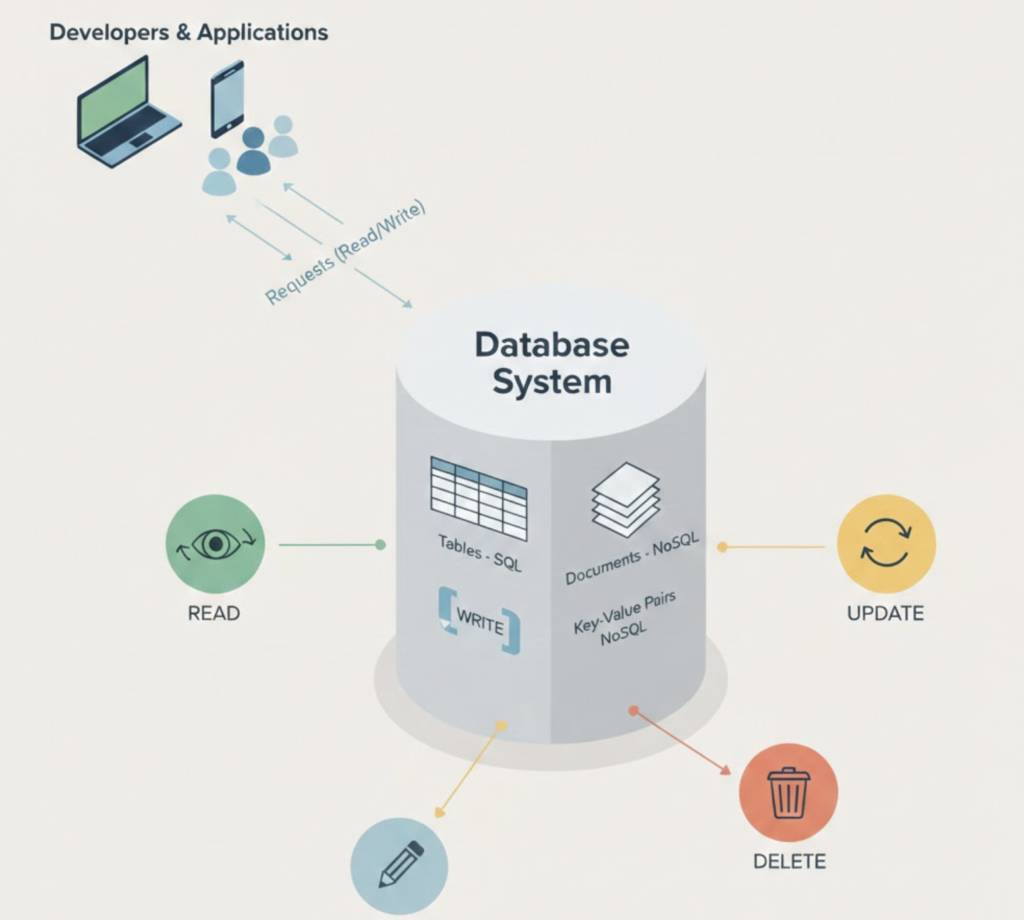
Redis
Redis is an open-source, in-memory data structure store used for caching, session storage, queues, and real-time analytics.
Prometheus
Prometheus is a metrics-based monitoring and alerting system that scrapes data from exporters and stores it as time-series data.
Grafana
Grafana provides visual dashboards, analytics, and alerting for metrics collected by Prometheus.
Redis Exporter
Redis Exporter exposes Redis internal metrics (memory usage, commands, connections, latency) in Prometheus format.
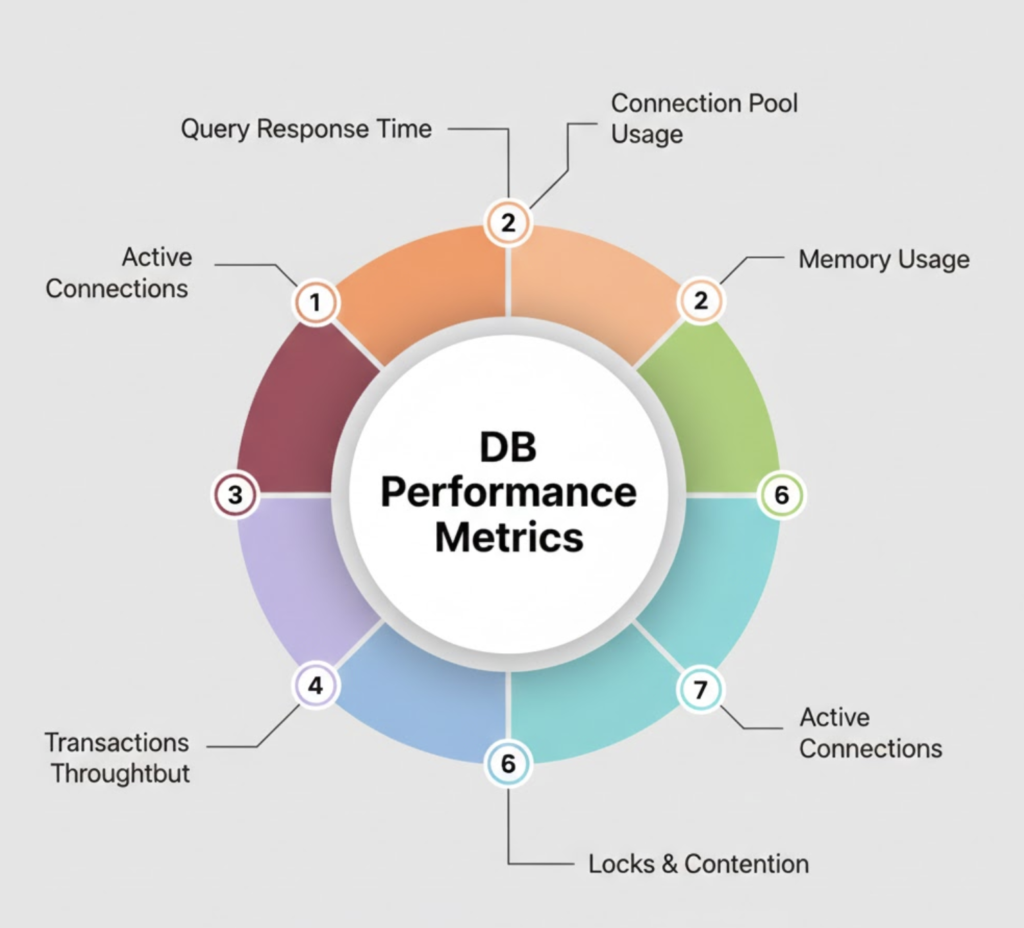
Why Monitor Redis with Prometheus and Grafana?
✔ Detect memory exhaustion early
✔ Monitor cache hit & miss ratio
✔ Track connected clients
✔ Identify slow commands
✔ Improve Redis performance and reliability
Redis Monitoring Architecture
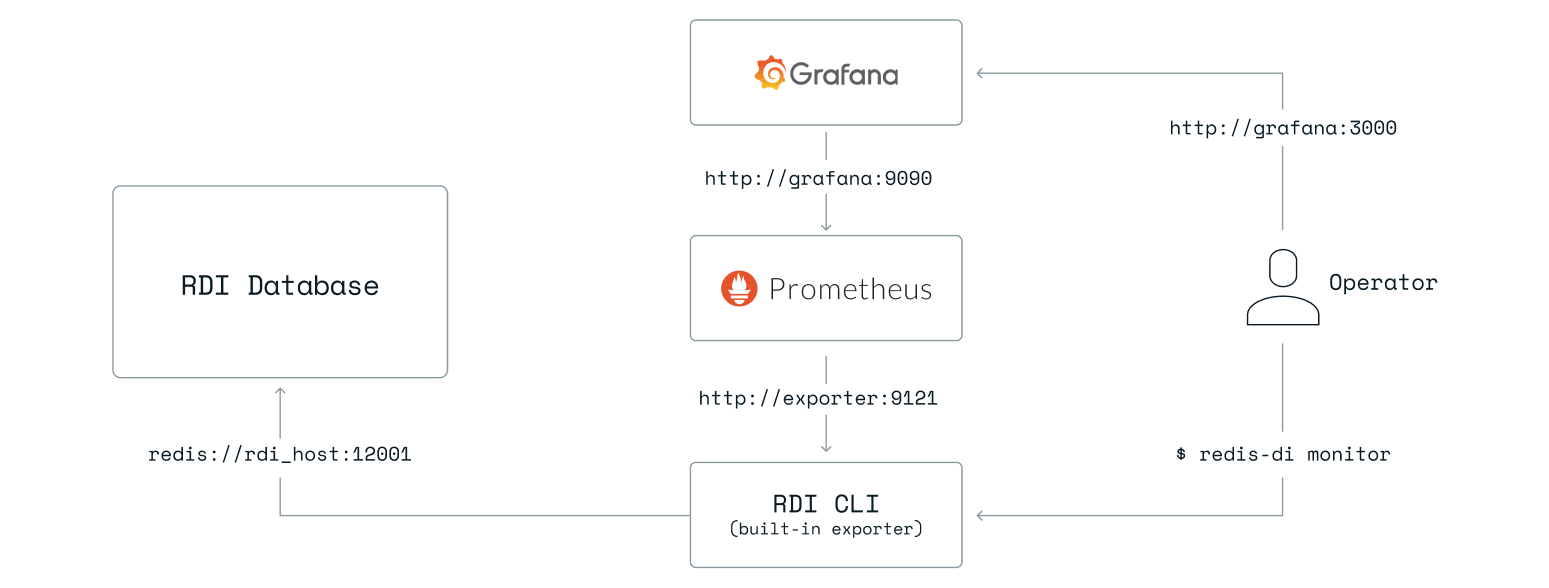
Data Flow
Redis → Redis Exporter → Prometheus → Grafana
System Requirements
| Component | Requirement |
|---|---|
| OS | RHEL 8/9 or Ubuntu |
| Redis | 6.x / 7.x |
| RAM | Minimum 2 GB |
| Ports | 9121, 9090, 3000 |
| Access | Redis AUTH (if enabled) |
Step 1: Prepare Redis for Monitoring
Check Redis status:
redis-cli ping
If authentication is enabled:
redis-cli -a StrongPassword ping
Step 2: Install Redis Exporter
cd /opt
sudo wget https://github.com/oliver006/redis_exporter/releases/download/v1.58.0/redis_exporter-v1.58.0.linux-amd64.tar.gz
Extract:
sudo tar -xvf redis_exporter-v1.58.0.linux-amd64.tar.gz
sudo mv redis_exporter-v1.58.0.linux-amd64 redis_exporter
Create Redis Exporter Service
sudo nano /etc/systemd/system/redis_exporter.service
[Unit]
Description=Redis Exporter
After=network.target

[Service]
User=root
ExecStart=/opt/redis_exporter/redis_exporter \
  --redis.addr=redis://localhost:6379 \
  --redis.password=StrongPassword

[Install]
WantedBy=multi-user.target
Remove
--redis.passwordif Redis auth is disabled.
Start exporter:
sudo systemctl daemon-reload
sudo systemctl enable redis_exporter
sudo systemctl start redis_exporter
Verify:
curl http://localhost:9121/metrics
Step 3: Configure Prometheus to Scrape Redis Metrics
Edit Prometheus config:
sudo nano /opt/prometheus/prometheus.yml
Add:
  - job_name: "redis"
    static_configs:
      - targets: ["localhost:9121"]
Restart Prometheus:
sudo systemctl restart prometheus
Verify target:
http://<server-ip>:9090/targets
Step 4: Install and Access Grafana
sudo dnf install -y https://dl.grafana.com/oss/release/grafana-10.2.3-1.x86_64.rpm
Start Grafana:
sudo systemctl enable grafana-server
sudo systemctl start grafana-server
Access:
http://<server-ip>:3000
Step 5: Add Prometheus Data Source in Grafana
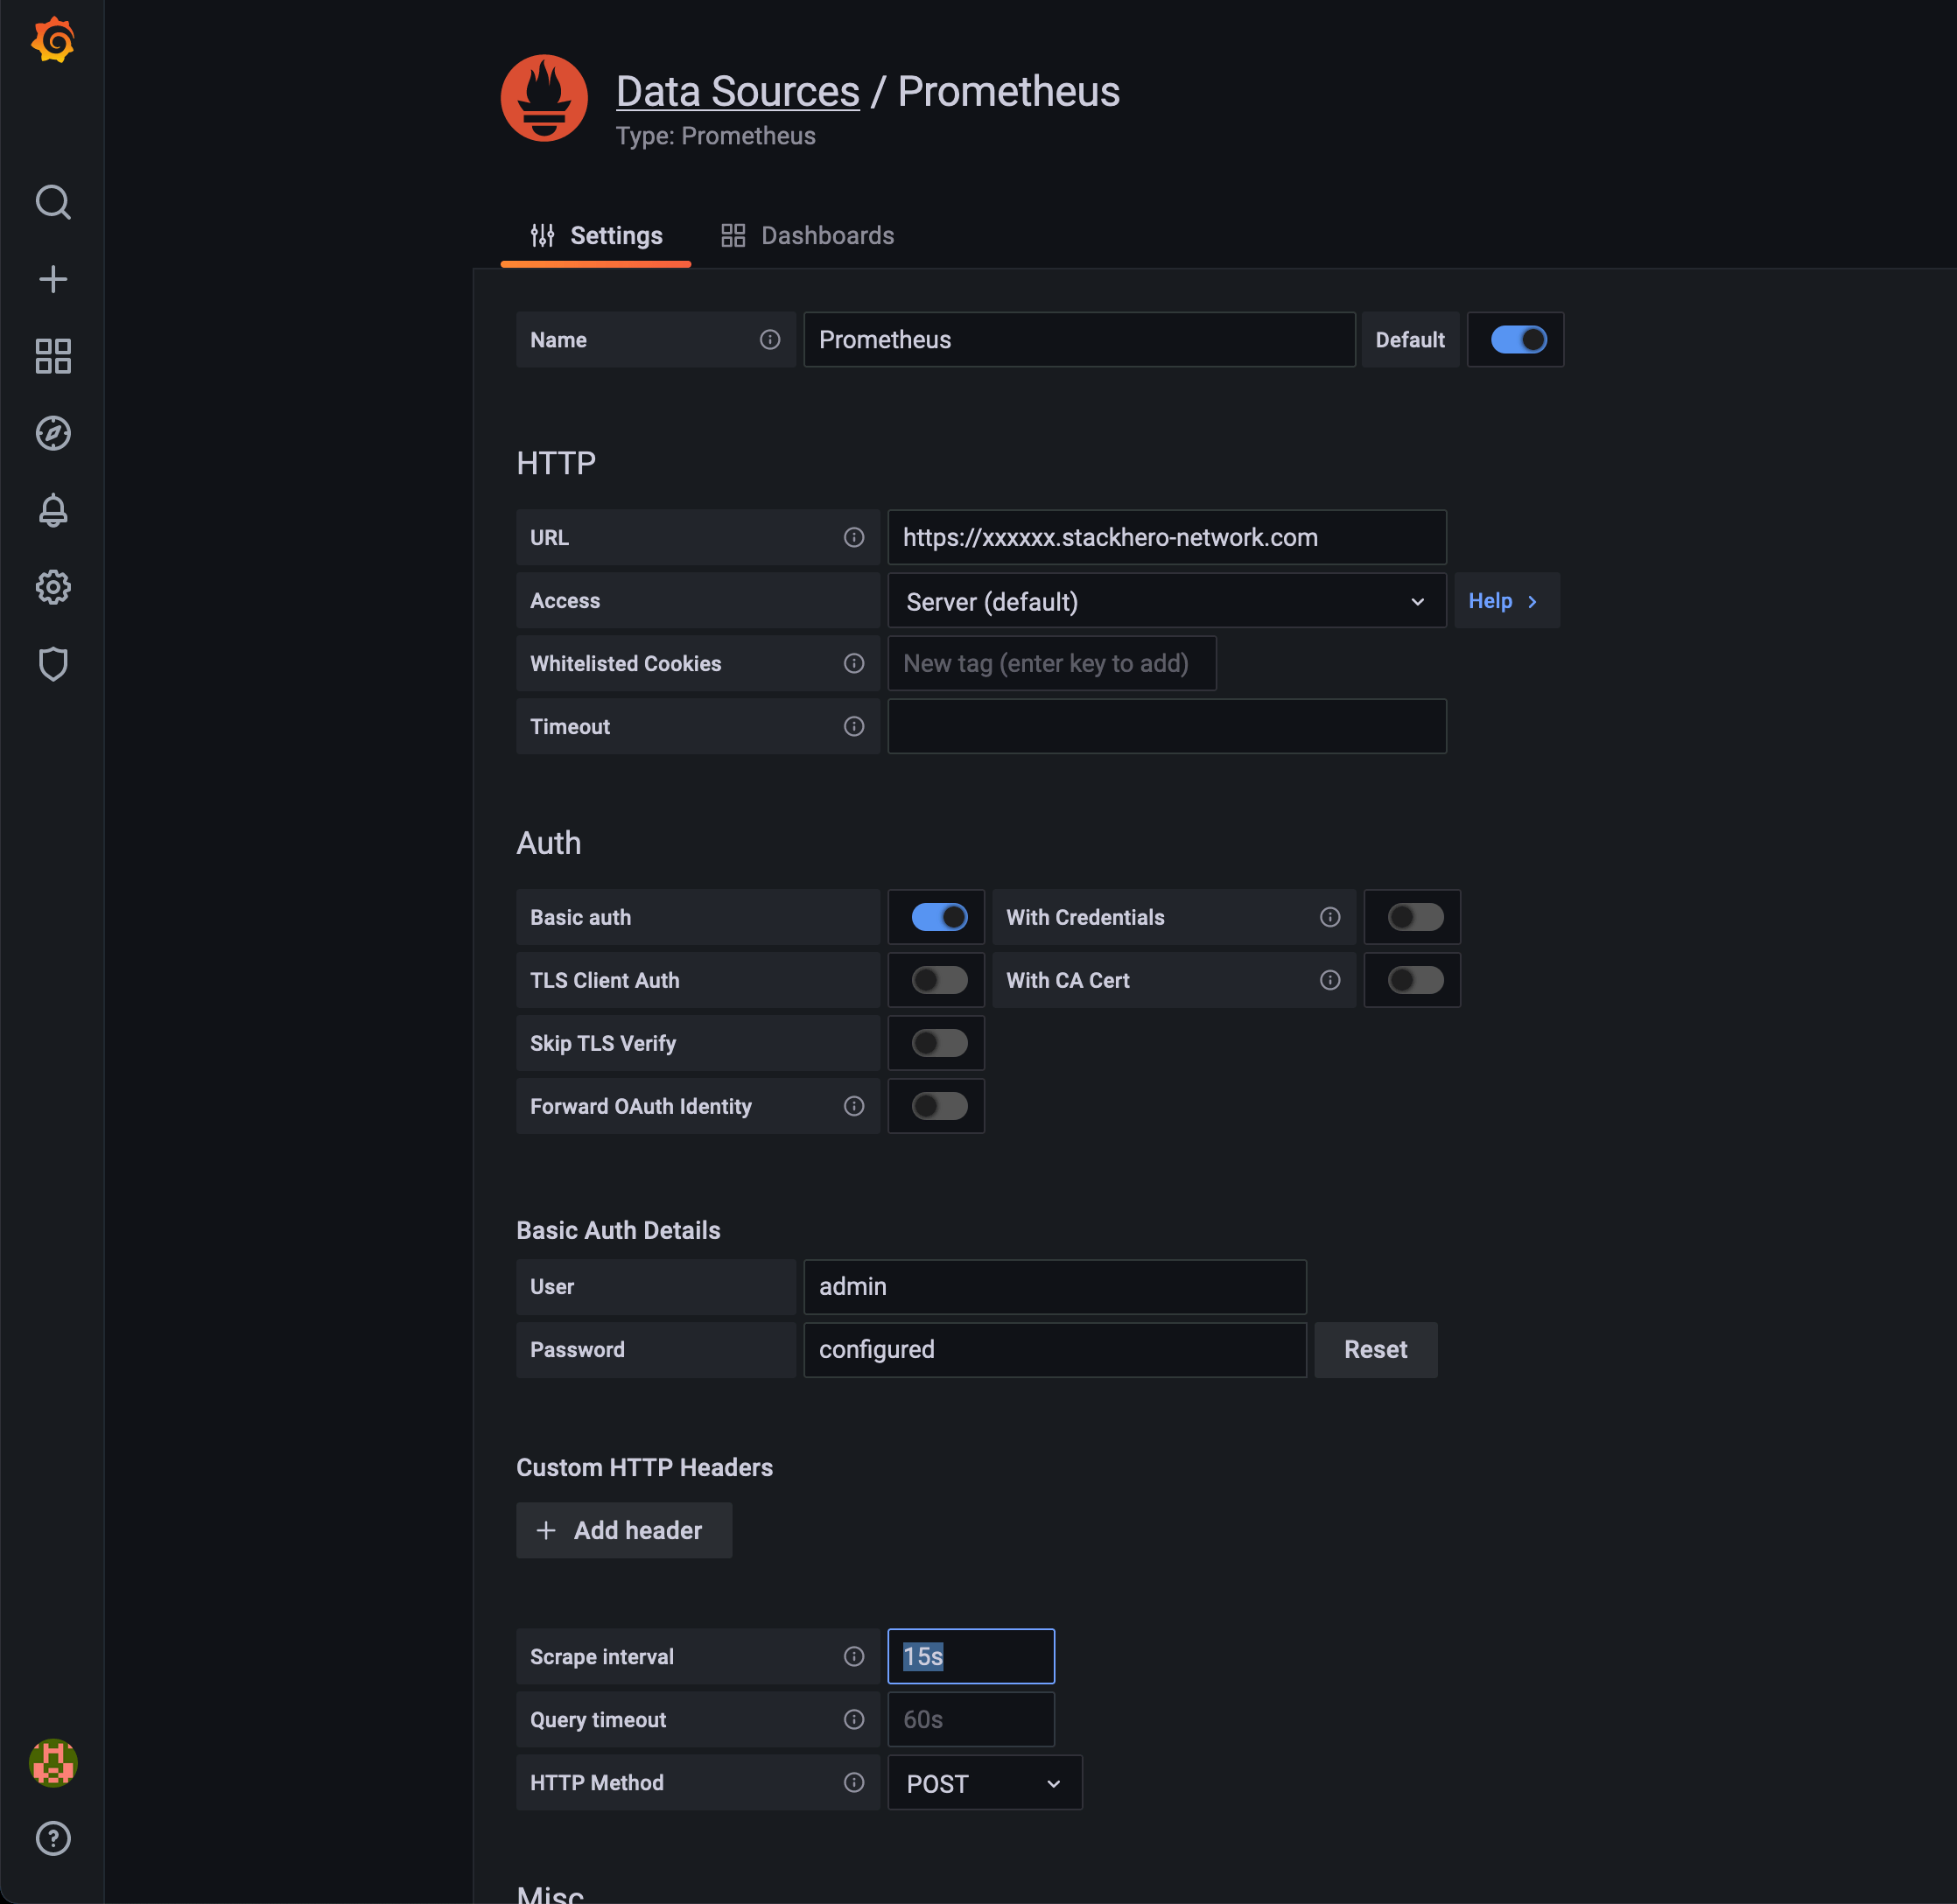
Steps:
- Grafana → ⚙ Settings → Data Sources
- Add Prometheus
- URL:
http://localhost:9090 - Save & Test
Step 6: Import Redis Grafana Dashboard
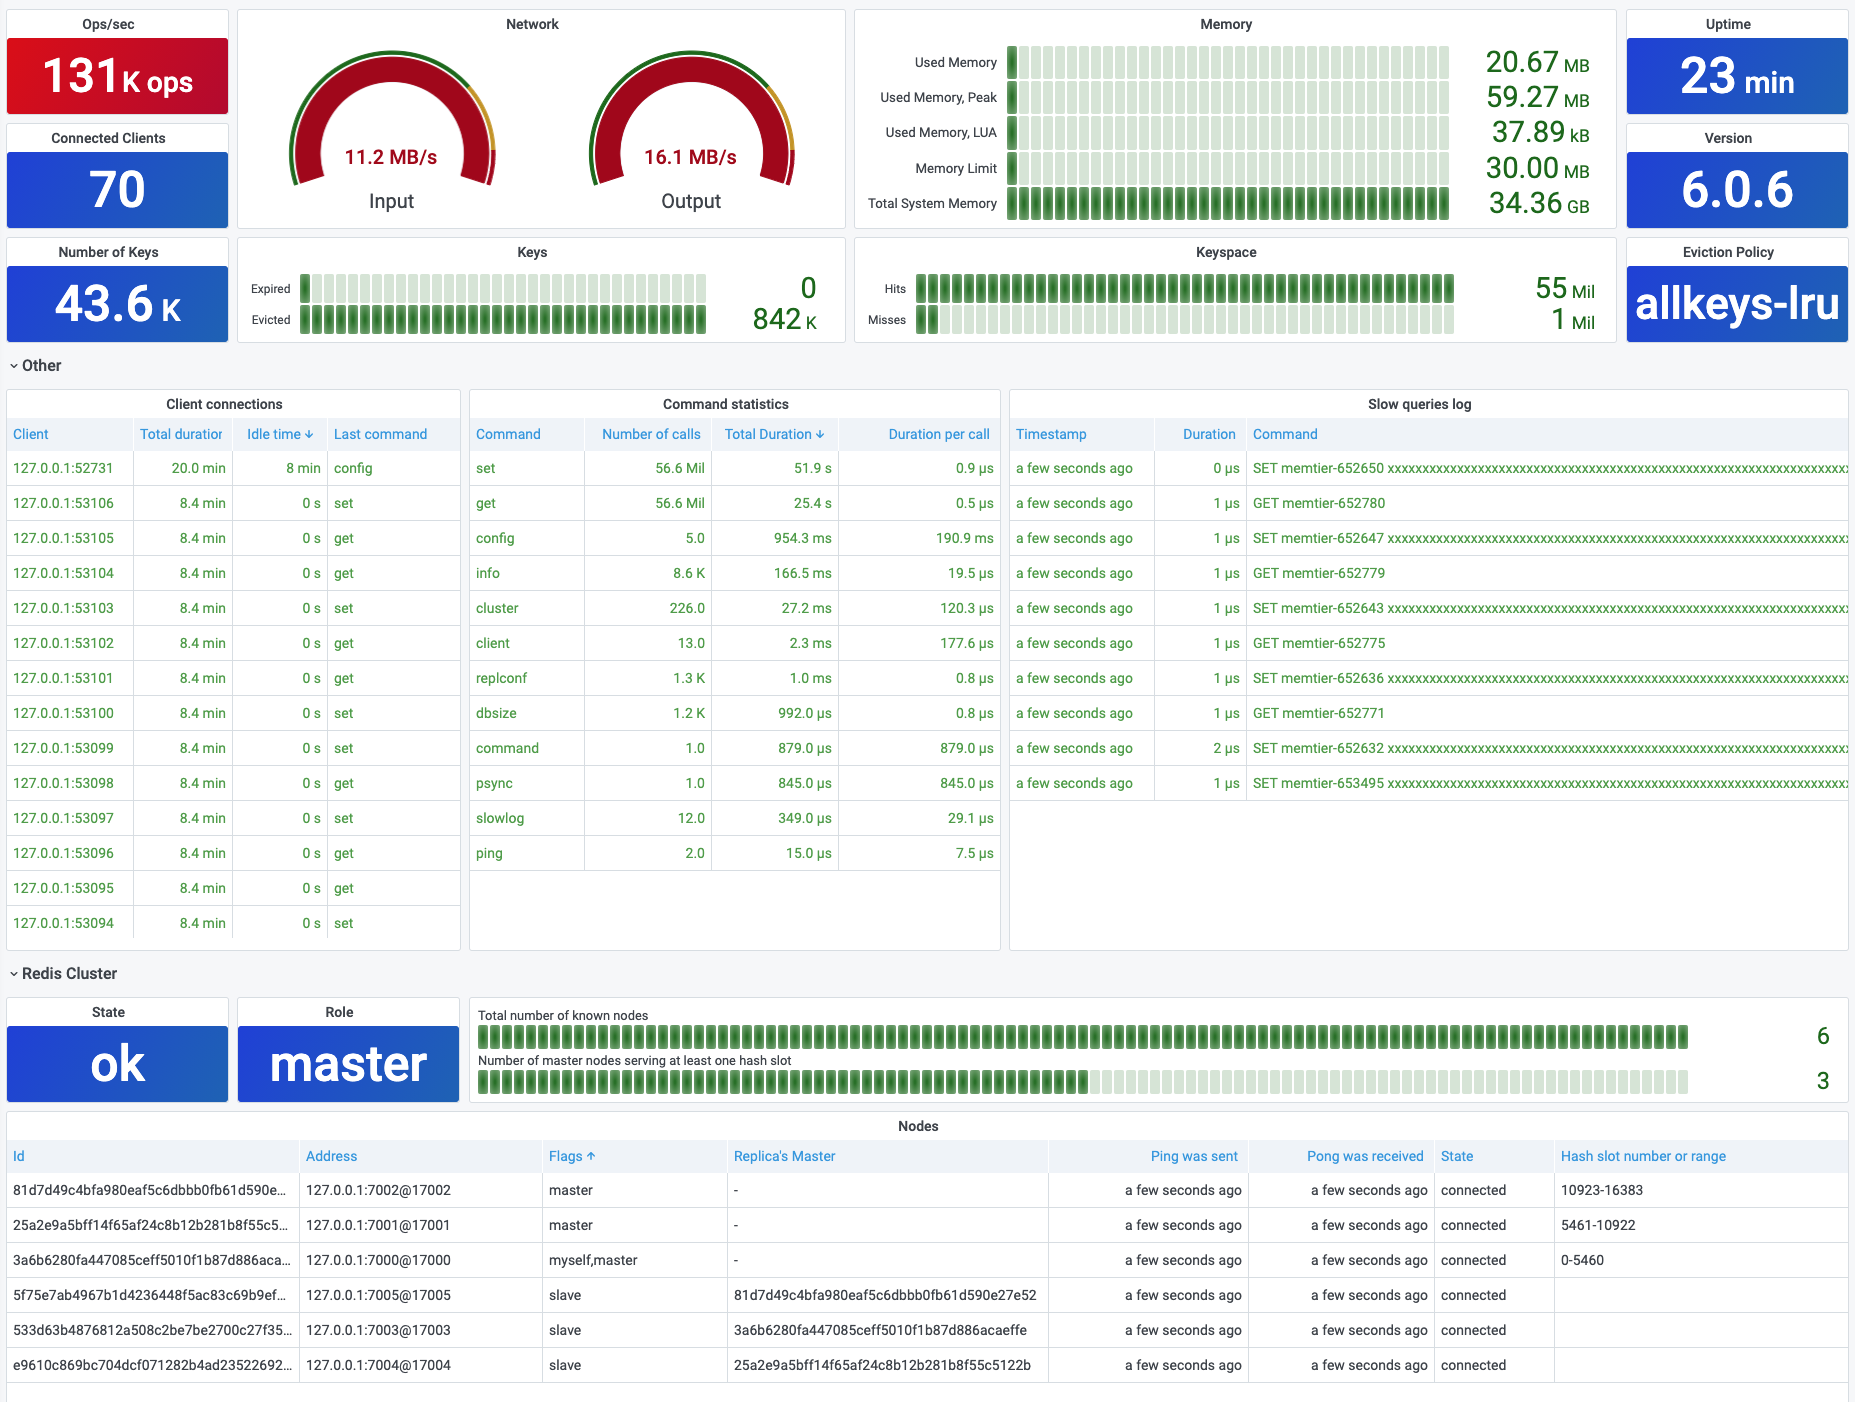
Recommended dashboard:
Dashboard ID: 11835
Steps:
- Grafana → Dashboards → Import
- Enter 11835
- Select Prometheus → Import
Key Redis Metrics You Can Monitor
✔ Used memory & memory fragmentation
✔ Connected clients
✔ Commands processed per second
✔ Cache hit & miss ratio
✔ Key eviction rate
✔ Redis uptime & role (master/replica)
Production Best Practices
✔ Set alerts for memory usage > 80%
✔ Monitor cache hit ratio continuously
✔ Secure Redis exporter endpoint
✔ Monitor Redis replication separately
✔ Use retention policies in Prometheus
Common Issues and Fixes
| Issue | Solution |
|---|---|
| No Redis data in Grafana | Check Prometheus target |
| Exporter auth error | Verify Redis password |
| Dashboard empty | Select correct datasource |
| High memory alerts | Tune maxmemory |
Redis Monitoring with Grafana vs Redis Native Tools
| Feature | Prometheus + Grafana | redis-cli |
|---|---|---|
| Visualization | Advanced | CLI only |
| Alerts | Yes | No |
| Historical metrics | Yes | No |
| Scalability | High | Low |
Conclusion
Monitoring Redis with Redis Exporter, Prometheus, and Grafana provides deep visibility into memory usage, performance, and reliability. This setup enables DevOps teams to prevent outages, optimize cache efficiency, and maintain high-performance Redis deployments.