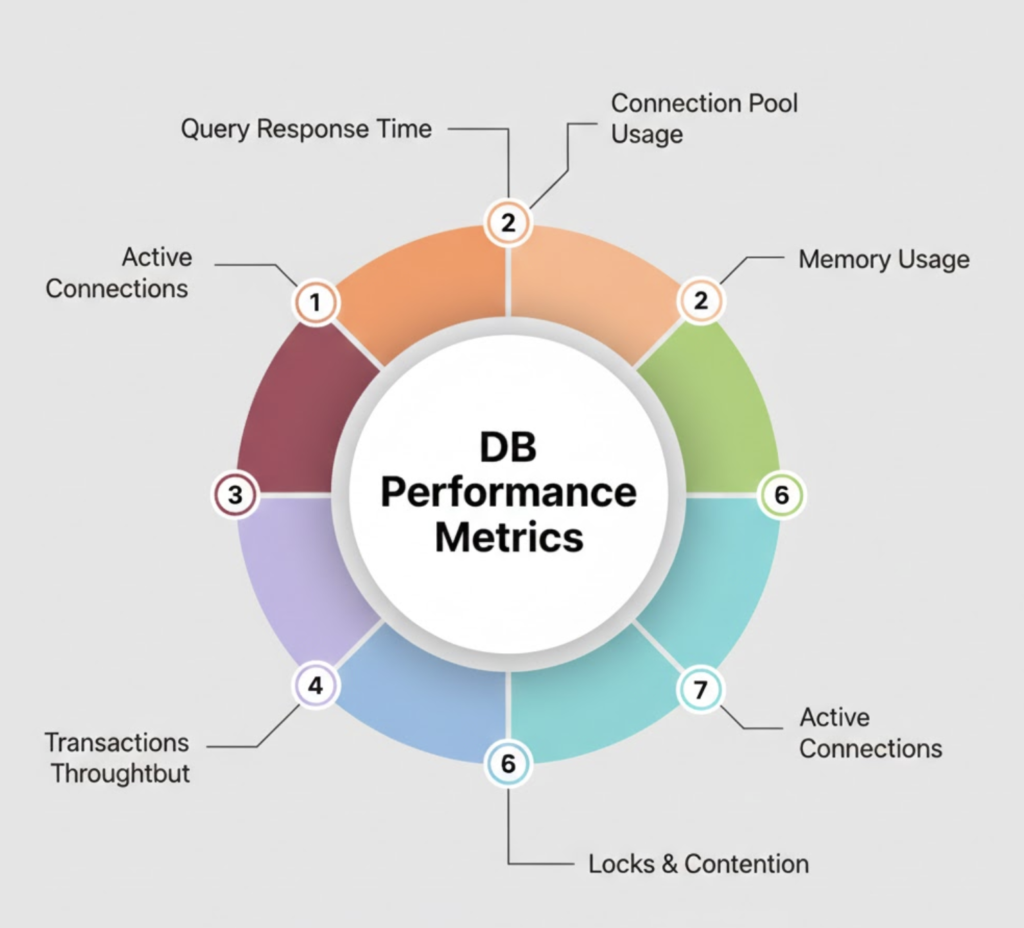
Monitoring MongoDB is critical for maintaining database performance, availability, and reliability in production environments. Metrics such as connections, memory usage, query performance, replication lag, and disk I/O help teams detect issues before they impact applications.
In this blog, you’ll learn how to monitor MongoDB using MongoDB Exporter and Grafana, starting from installation and ending with real-time dashboards and visual insights.
What Is MongoDB Exporter and Grafana?
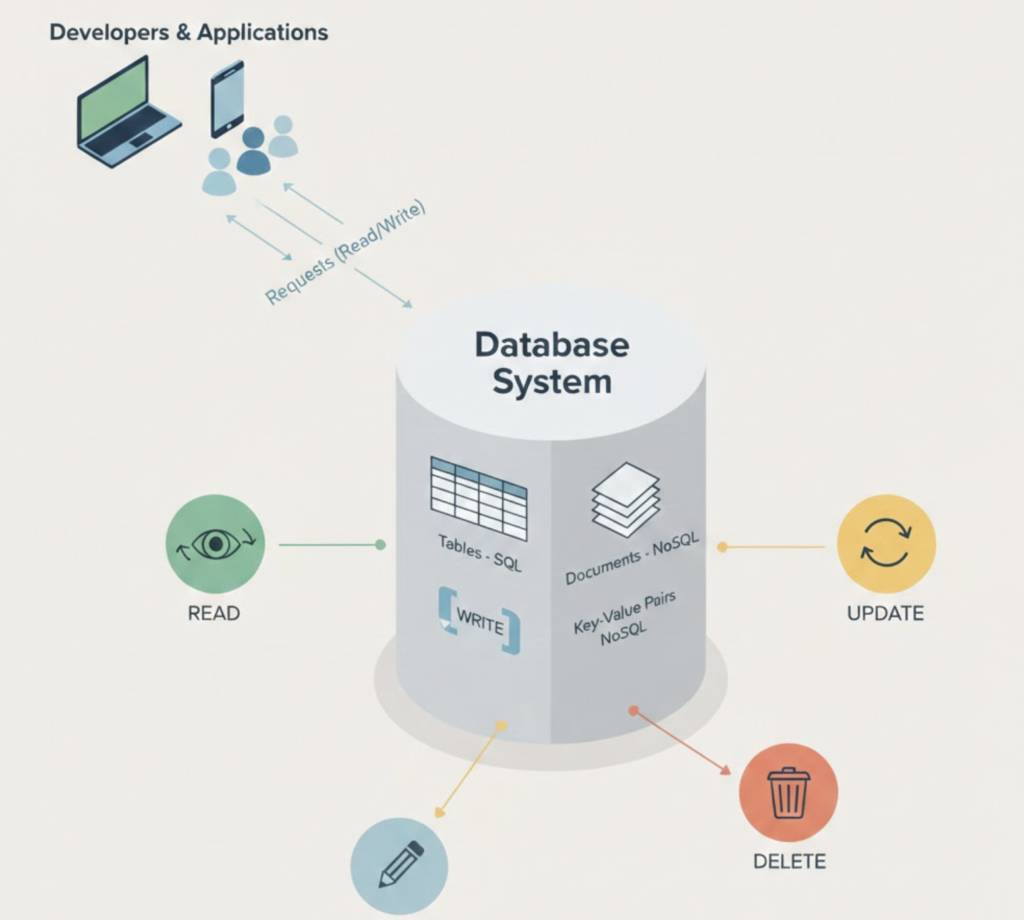
MongoDB
MongoDB is a NoSQL document-based database widely used for modern, scalable applications.
Prometheus
Prometheus is an open-source monitoring system that collects metrics using a pull-based model.
MongoDB Exporter
MongoDB Exporter exposes MongoDB internal metrics in Prometheus format.
Grafana
Grafana visualizes MongoDB metrics using interactive dashboards and alerts.
Why Monitor MongoDB with Grafana?
✔ Real-time database performance insights
✔ Early detection of replication lag
✔ Monitor active connections & slow queries
✔ Capacity planning & trend analysis
✔ Production-grade observability
Monitoring Architecture Overview
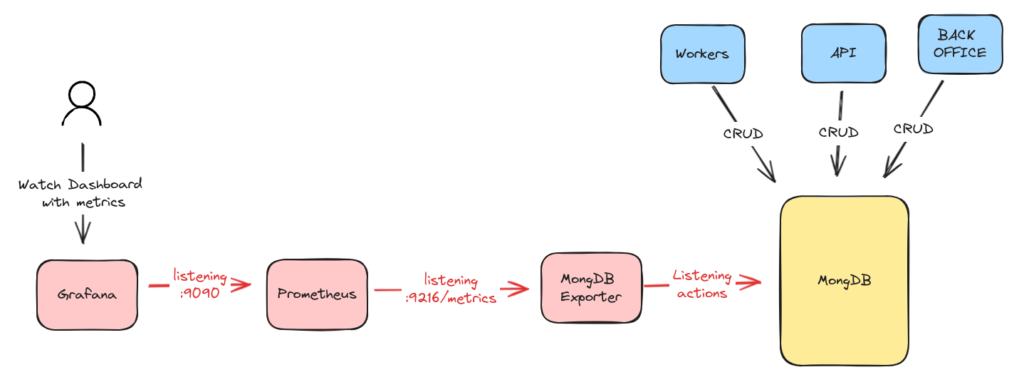
Data Flow
MongoDB → MongoDB Exporter → Prometheus → Grafana
System Requirements
| Component | Requirement |
|---|---|
| OS | RHEL 8 / RHEL 9 / Ubuntu |
| MongoDB | 4.x / 5.x / 6.x |
| RAM | Minimum 2 GB |
| Ports | 9216, 9090, 3000 |
| Access | MongoDB user with read privileges |
Step 1: Create MongoDB Monitoring User
Login to MongoDB shell:
mongosh
Create user:
use admin
db.createUser({
  user: "exporter",
  pwd: "StrongPassword",
  roles: [
    { role: "clusterMonitor", db: "admin" },
    { role: "readAnyDatabase", db: "admin" }
  ]
})
Step 2: Install MongoDB Exporter
cd /opt
sudo wget https://github.com/percona/mongodb_exporter/releases/download/v0.40.0/mongodb_exporter-0.40.0.linux-amd64.tar.gz
Extract:
sudo tar -xvf mongodb_exporter-0.40.0.linux-amd64.tar.gz
sudo mv mongodb_exporter-0.40.0.linux-amd64 mongodb_exporter
Create MongoDB Exporter Service
sudo nano /etc/systemd/system/mongodb_exporter.service
[Unit]
Description=MongoDB Exporter
After=network.target

[Service]
User=root
ExecStart=/opt/mongodb_exporter/mongodb_exporter \
  --mongodb.uri=mongodb://exporter:StrongPassword@localhost:27017/admin

[Install]
WantedBy=multi-user.target
Start exporter:
sudo systemctl daemon-reload
sudo systemctl enable mongodb_exporter
sudo systemctl start mongodb_exporter
Verify:
curl http://localhost:9216/metrics
Step 3: Configure Prometheus to Scrape MongoDB Metrics
Edit Prometheus config:
sudo nano /opt/prometheus/prometheus.yml
Add:
  - job_name: "mongodb"
    static_configs:
      - targets: ["localhost:9216"]
Reload Prometheus:
sudo systemctl restart prometheus
Check targets:
http://<server-ip>:9090/targets
Step 4: Install and Configure Grafana
Install Grafana:
sudo dnf install -y https://dl.grafana.com/oss/release/grafana-10.2.3-1.x86_64.rpm
Start Grafana:
sudo systemctl enable grafana-server
sudo systemctl start grafana-server
Access:
http://<server-ip>:3000
Step 5: Add Prometheus Data Source in Grafana
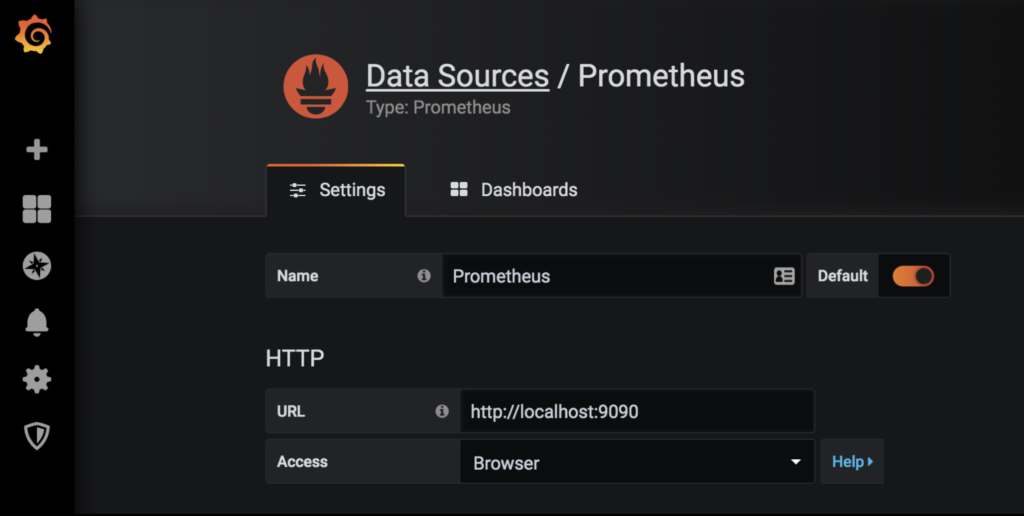
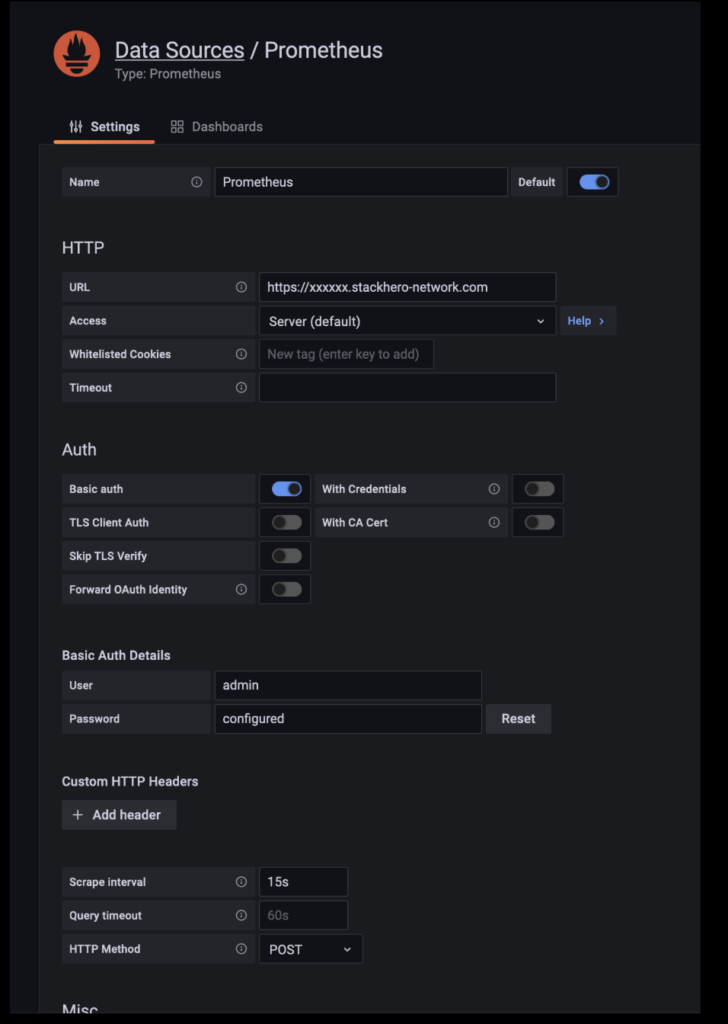
Steps:
- Grafana → Settings → Data Sources
- Select Prometheus
- URL:
http://localhost:9090 - Save & Test
Import MongoDB Grafana Dashboard
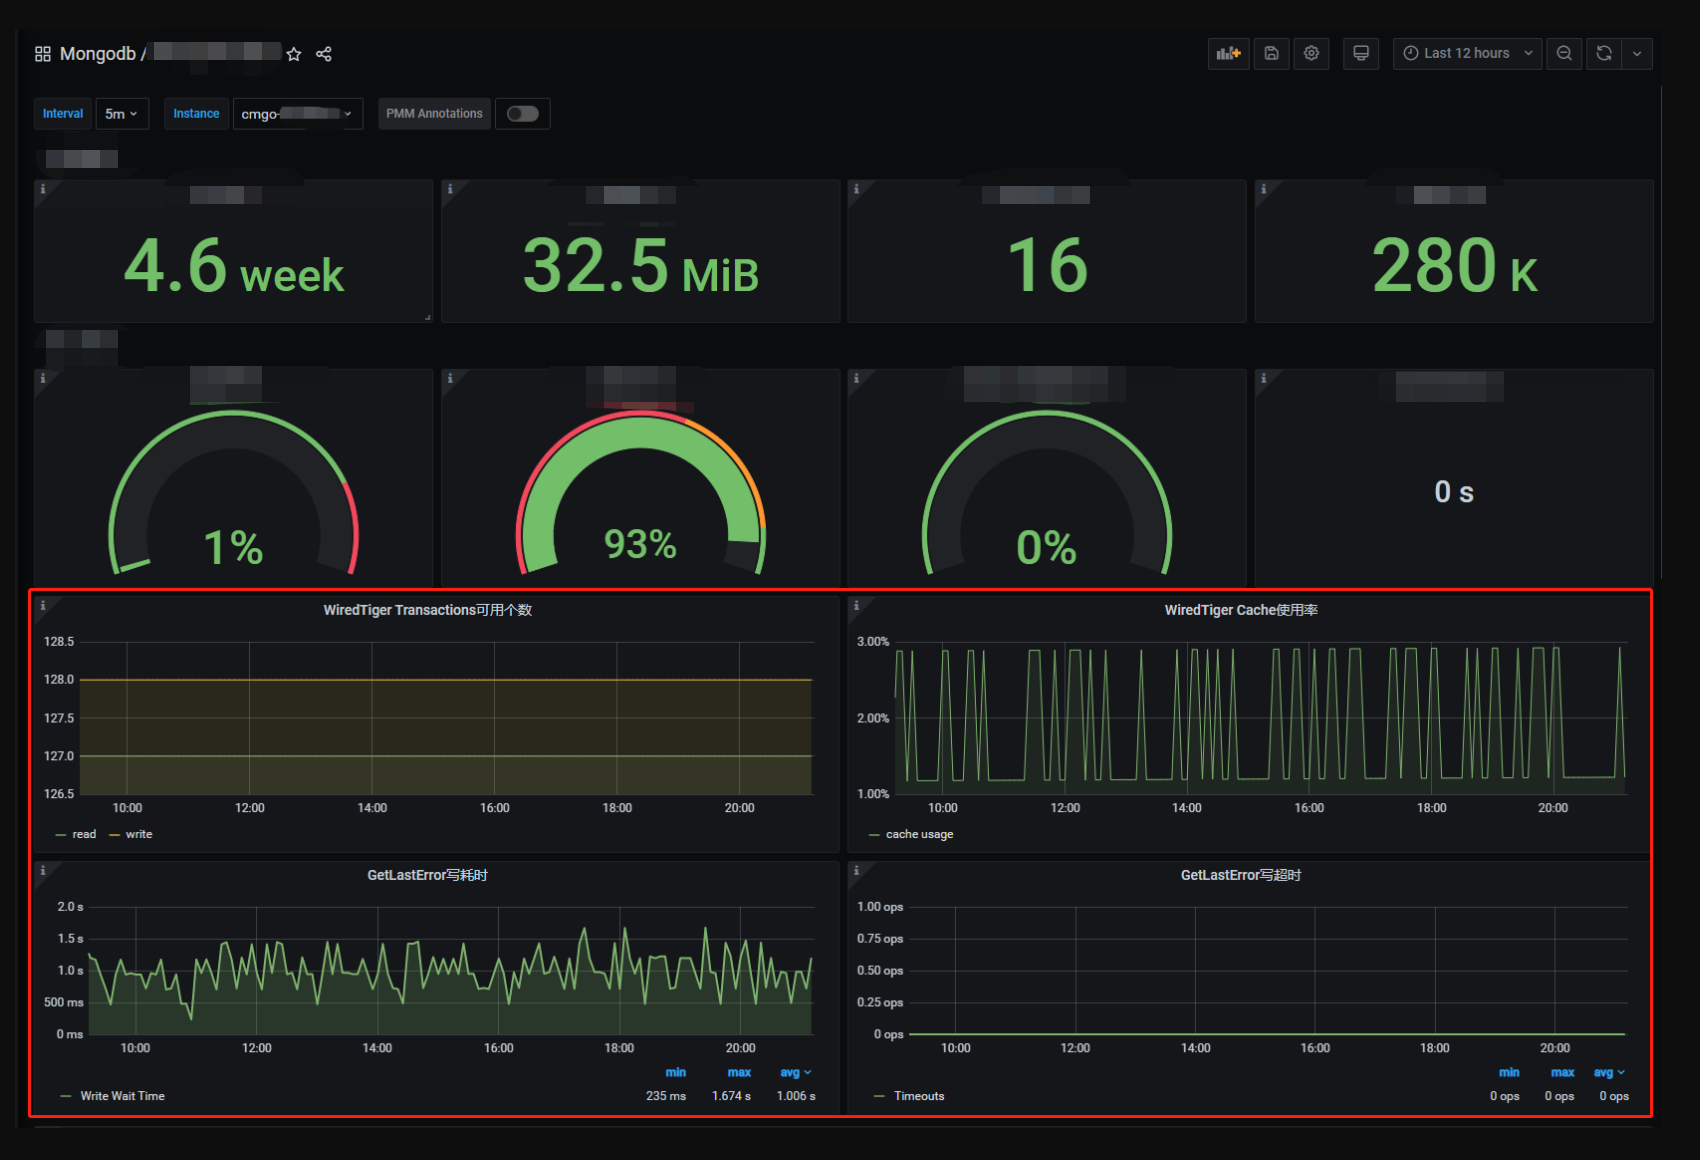
Steps:
- Grafana → Dashboards → Import
- Dashboard ID:
2583 - Select Prometheus → Import
Key MongoDB Metrics You Can Monitor
✔ Active & available connections
✔ Query operations (insert, update, delete)
✔ Replication lag
✔ WiredTiger cache usage
✔ Memory & CPU consumption
✔ Disk I/O & storage growth
Production Best Practices
✔ Use a dedicated MongoDB monitoring user
✔ Enable authentication & TLS
✔ Secure exporter endpoint
✔ Monitor replica sets individually
✔ Set Grafana alerts for thresholds
Common Issues and Fixes
| Issue | Solution |
|---|---|
| No metrics in Grafana | Check Prometheus targets |
| Exporter not starting | Verify MongoDB URI |
| Authentication error | Check user roles |
| Dashboard empty | Select correct data source |
MongoDB Exporter vs Native Monitoring
| Feature | MongoDB Exporter | Native Tools |
|---|---|---|
| Visualization | Grafana | Limited |
| Alerts | Yes | Limited |
| Custom dashboards | Yes | No |
| Integration | Prometheus | Standalone |
Conclusion
Monitoring MongoDB with MongoDB Exporter and Grafana provides deep visibility into database performance, enabling teams to detect issues early, optimize resources, and ensure high availability.
This setup is production-ready, scalable, and ideal for modern cloud and on-prem MongoDB deployments.