
Modern infrastructure demands real-time visibility into server performance. Whether you’re a System Administrator, DevOps Engineer, or SRE, monitoring Linux servers is critical for ensuring performance, reliability, and uptime.
In this blog, you’ll learn how to monitor a RHEL VM using Prometheus Node Exporter and Grafana, starting from scratch and ending with powerful dashboards and visualizations.
What Is Prometheus and Grafana?
Prometheus
Prometheus is an open-source monitoring and alerting system designed for reliability and scalability. It collects metrics using a pull-based model.
Grafana
Grafana is an open-source analytics and visualization platform that transforms metrics into beautiful dashboards.
Node Exporter
Node Exporter exposes hardware and OS-level metrics such as CPU, memory, disk, and network usage from Linux servers.
Why Use Prometheus + Grafana for Linux Monitoring?
1.Agent-based metric collection
2.Real-time performance monitoring
3.Powerful dashboards
4.Production-ready & scalable
5.Widely used in Kubernetes & cloud platforms
Monitoring Architecture Overview
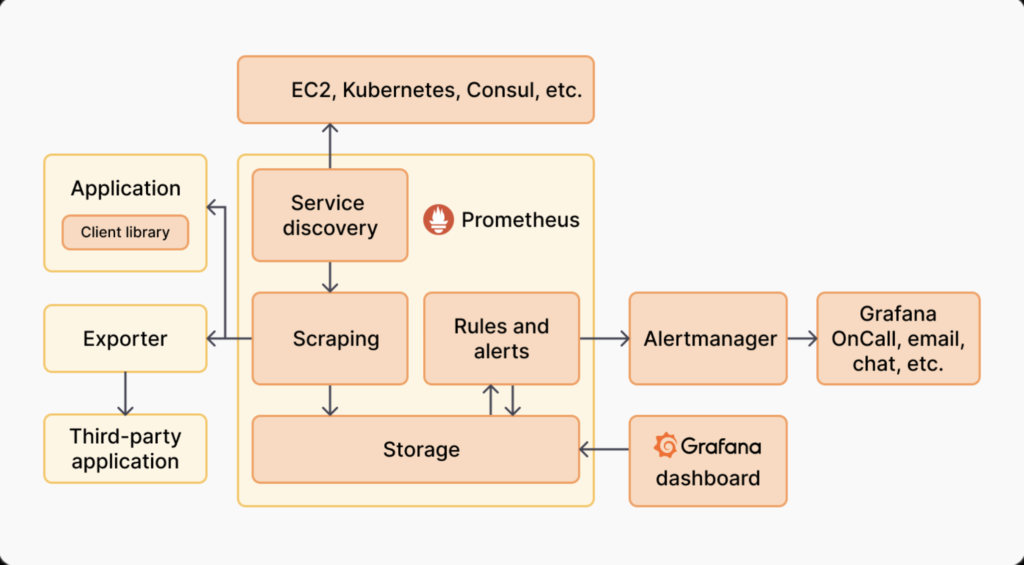
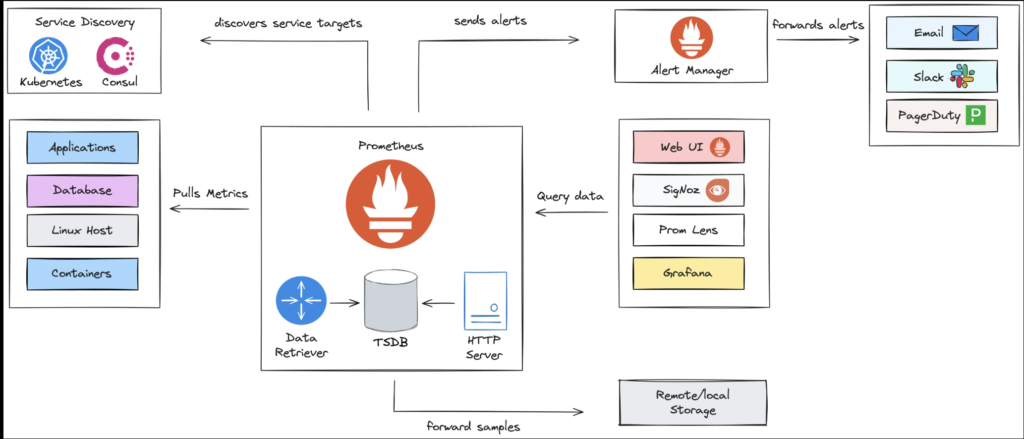
Data Flow
RHEL VM → Node Exporter → Prometheus → Grafana
System Requirements
| Component | Requirement |
|---|---|
| OS | RHEL 8 / RHEL 9 |
| RAM | Minimum 2 GB |
| CPU | 1 Core |
| Ports | 9100, 9090, 3000 |
| User | root or sudo |
Step 1: Prepare RHEL VM
sudo dnf update -y
sudo dnf install wget curl vim -y
Disable firewall (lab only):
sudo systemctl stop firewalld
sudo systemctl disable firewalld
Step 2: Install Node Exporter on RHEL
Download Node Exporter:
cd /opt
sudo wget https://github.com/prometheus/node_exporter/releases/download/v1.7.0/node_exporter-1.7.0.linux-amd64.tar.gz
Extract:
sudo tar -xvf node_exporter-1.7.0.linux-amd64.tar.gz
sudo mv node_exporter-1.7.0.linux-amd64 node_exporter
Create Node Exporter Service
sudo nano /etc/systemd/system/node_exporter.service
[Unit]
Description=Prometheus Node Exporter
After=network.target

[Service]
User=root
ExecStart=/opt/node_exporter/node_exporter

[Install]
WantedBy=multi-user.target
Start service:
sudo systemctl daemon-reexec
sudo systemctl daemon-reload
sudo systemctl enable node_exporter
sudo systemctl start node_exporter
Verify:
curl http://localhost:9100/metrics
Step 3: Install Prometheus
Download Prometheus:
cd /opt
sudo wget https://github.com/prometheus/prometheus/releases/download/v2.50.0/prometheus-2.50.0.linux-amd64.tar.gz
Extract:
sudo tar -xvf prometheus-2.50.0.linux-amd64.tar.gz
sudo mv prometheus-2.50.0.linux-amd64 prometheus
Configure Prometheus
sudo nano /opt/prometheus/prometheus.yml
global:
  scrape_interval: 15s

scrape_configs:
  - job_name: "rhel-node"
    static_configs:
      - targets: ["localhost:9100"]
Create Prometheus Service
sudo nano /etc/systemd/system/prometheus.service
[Unit]
Description=Prometheus Monitoring
After=network.target

[Service]
User=root
ExecStart=/opt/prometheus/prometheus \
  --config.file=/opt/prometheus/prometheus.yml \
  --storage.tsdb.path=/opt/prometheus/data

[Install]
WantedBy=multi-user.target
Start Prometheus:
sudo systemctl daemon-reload
sudo systemctl enable prometheus
sudo systemctl start prometheus
Access Prometheus:
http://<server-ip>:9090
Step 4: Install Grafana
Install Grafana repository:
sudo dnf install -y https://dl.grafana.com/oss/release/grafana-10.2.3-1.x86_64.rpm
Start Grafana:
sudo systemctl enable grafana-server
sudo systemctl start grafana-server
Access Grafana:
http://<server-ip>:3000
Default login:
Username: admin
Password: admin
Step 5: Add Prometheus Data Source in Grafana
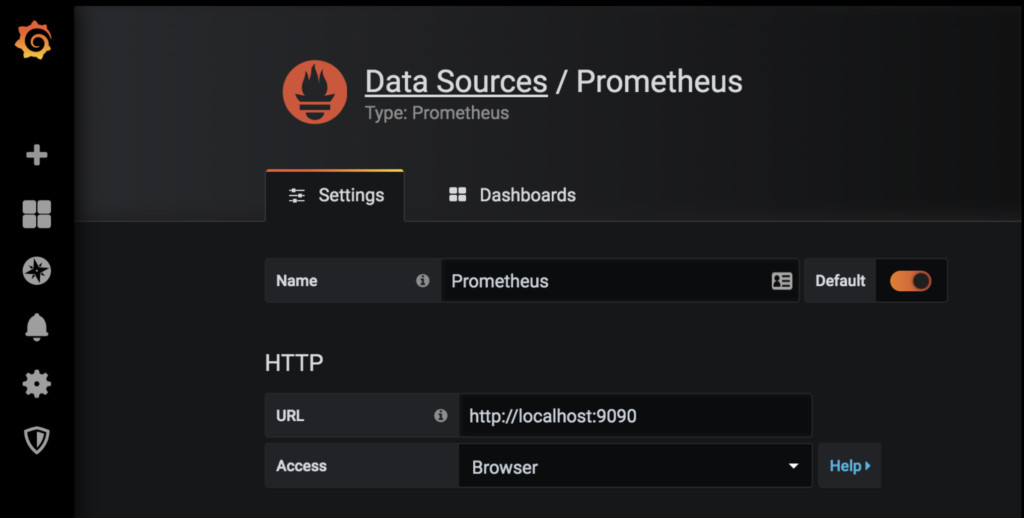
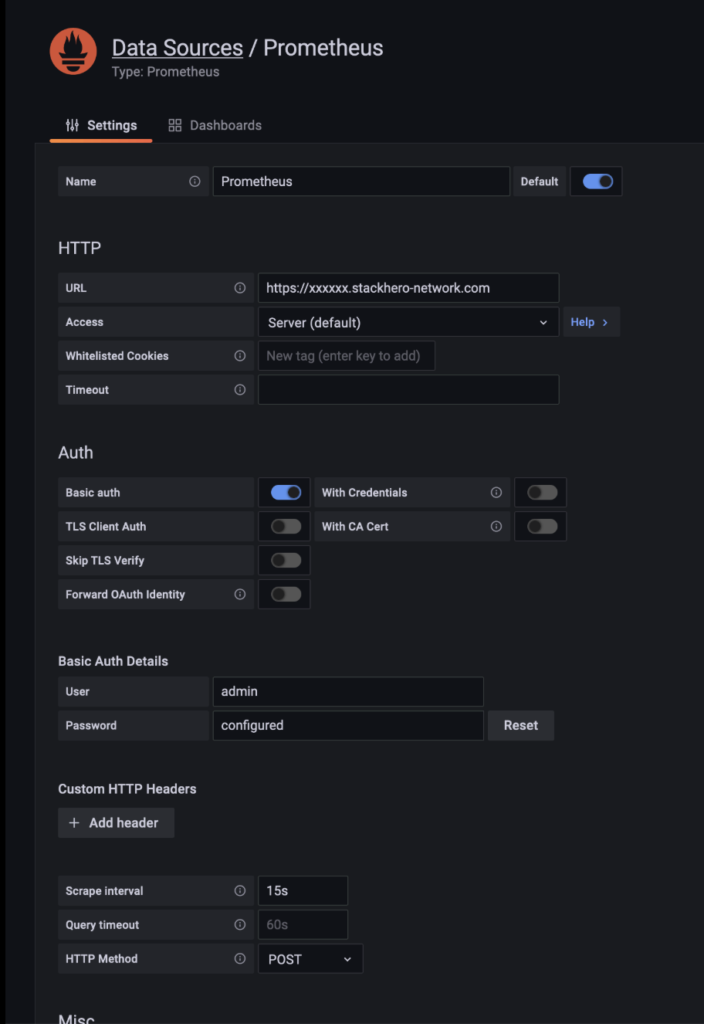
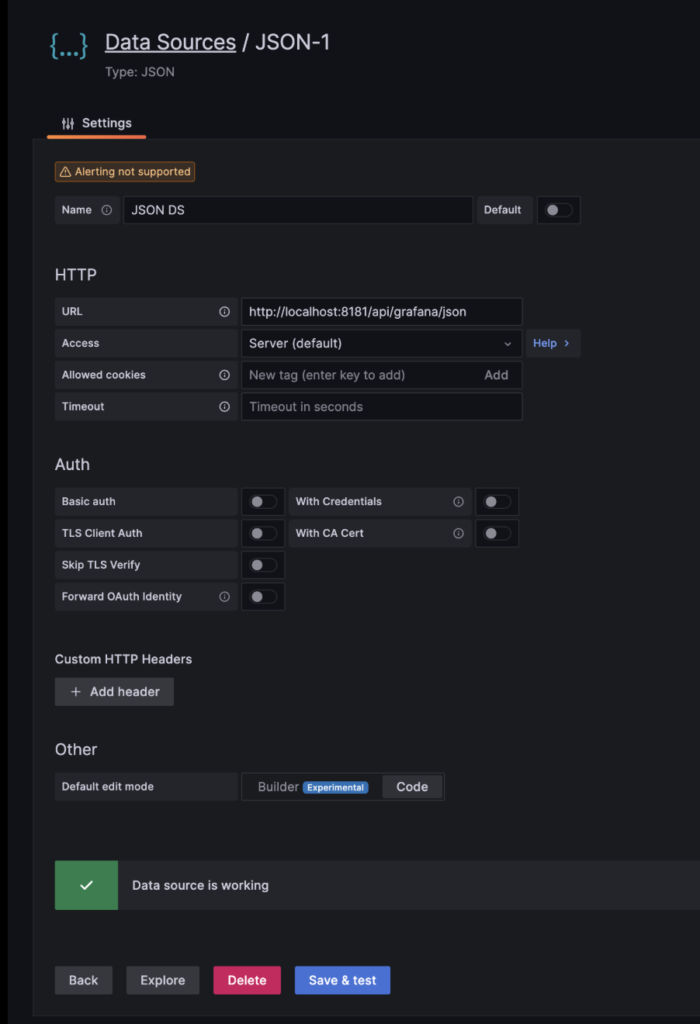
Steps:
- Grafana → ⚙ Settings → Data Sources
- Add Prometheus
- URL:
http://localhost:9090 - Save & Test
Step 6: Import Node Exporter Dashboard
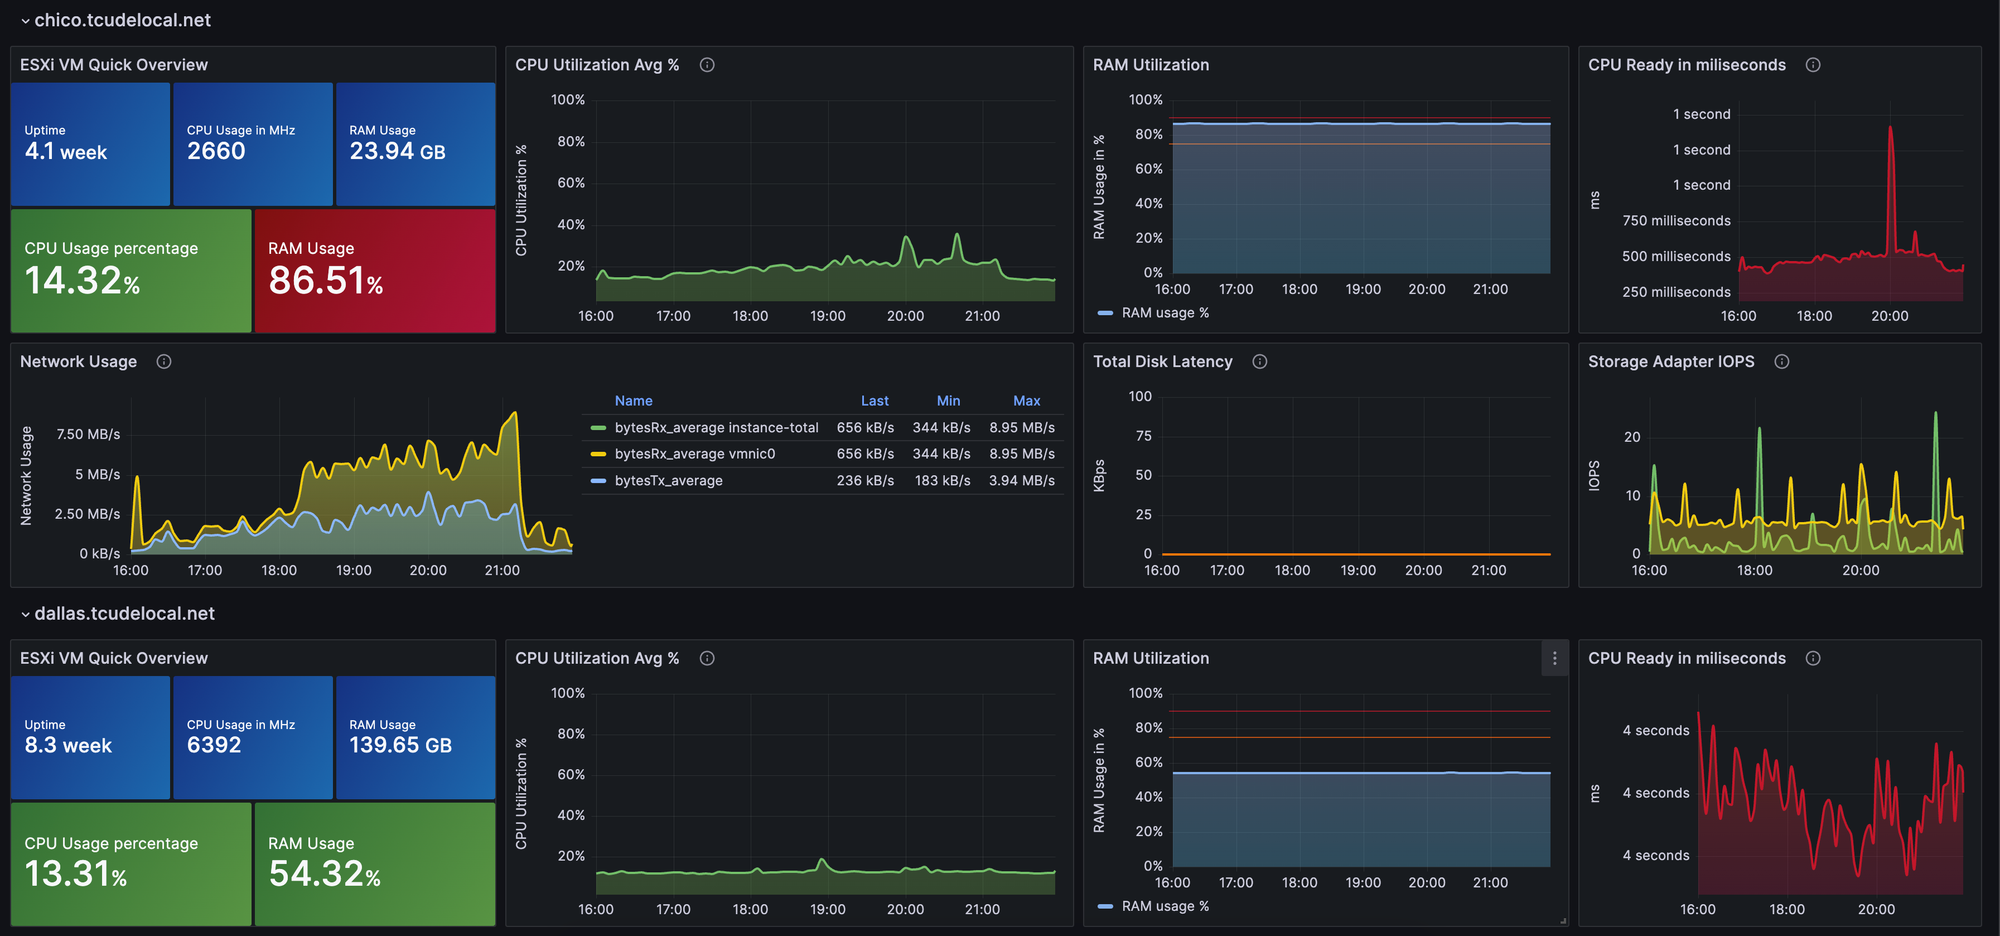
Steps:
- Grafana → Dashboards → Import
- Dashboard ID:
1860 - Select Prometheus → Import
Key Metrics You Can Monitor
✔ CPU usage & load
✔ Memory utilization
✔ Disk read/write & space
✔ Network traffic
✔ System uptime
✔ File system health
Optional: Enable Alerts in Grafana
You can configure alerts for:
- High CPU usage (>80%)
- Low disk space (<10%)
- Memory saturation
- Server down
Grafana supports:
- Email alerts
- Slack alerts
- Webhook alerts
Production Best Practices
✔ Run Prometheus on a dedicated server
✔ Enable firewall rules instead of disabling
✔ Use HTTPS & authentication
✔ Add Alertmanager
✔ Use long-term storage (Thanos / Cortex)
Common Issues and Fixes
| Issue | Solution |
|---|---|
| No data in Grafana | Check Prometheus targets |
| Node Exporter down | Check port 9100 |
| High memory usage | Reduce scrape interval |
| Dashboard empty | Select correct data source |
Conclusion
Using Prometheus Node Exporter and Grafana, you can build a powerful Linux server monitoring system for RHEL VMs. This setup is lightweight, scalable, and production-proven, making it ideal for on-prem, cloud, and hybrid environments.