Learn how to monitor database performance, identify bottlenecks, and apply best practices for reliable database operations.
Why Database Performance Matters
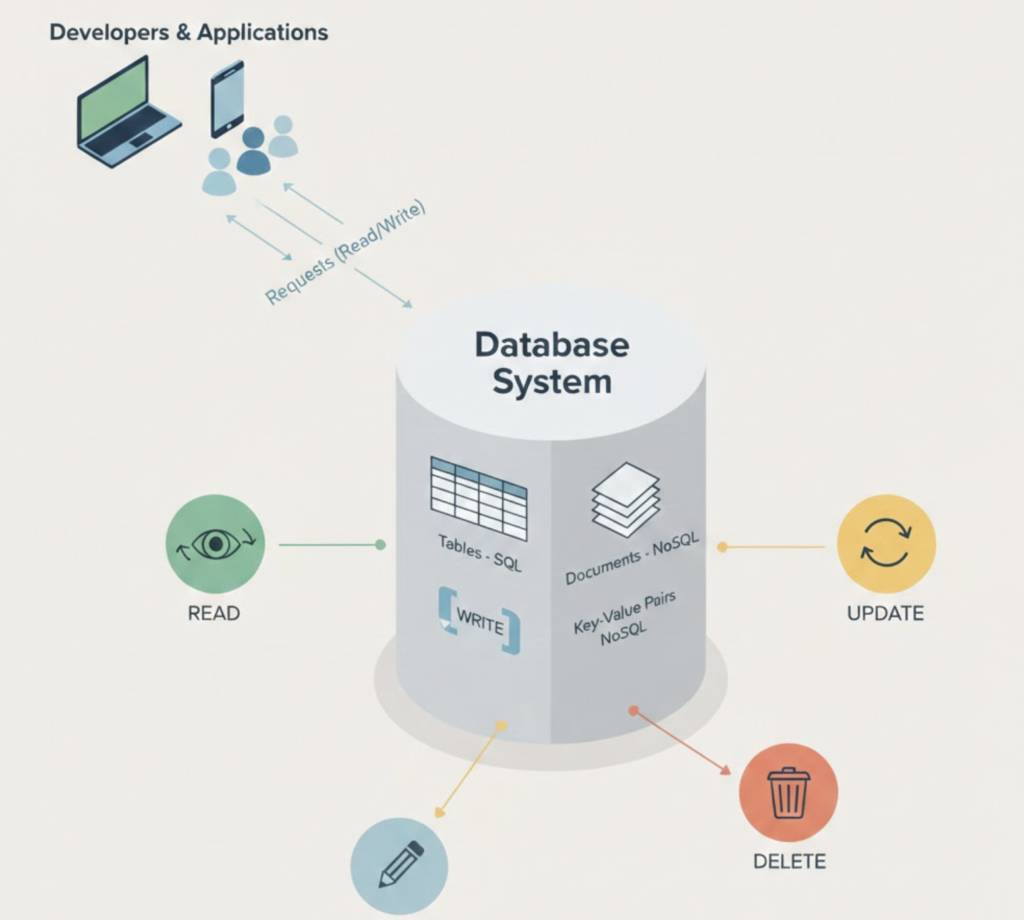
Database performance directly impacts application speed, user experience, and infrastructure costs. Even well-designed applications can fail if the database becomes a bottleneck.
Performance management requires continuous monitoring and tuning, not one-time fixes.
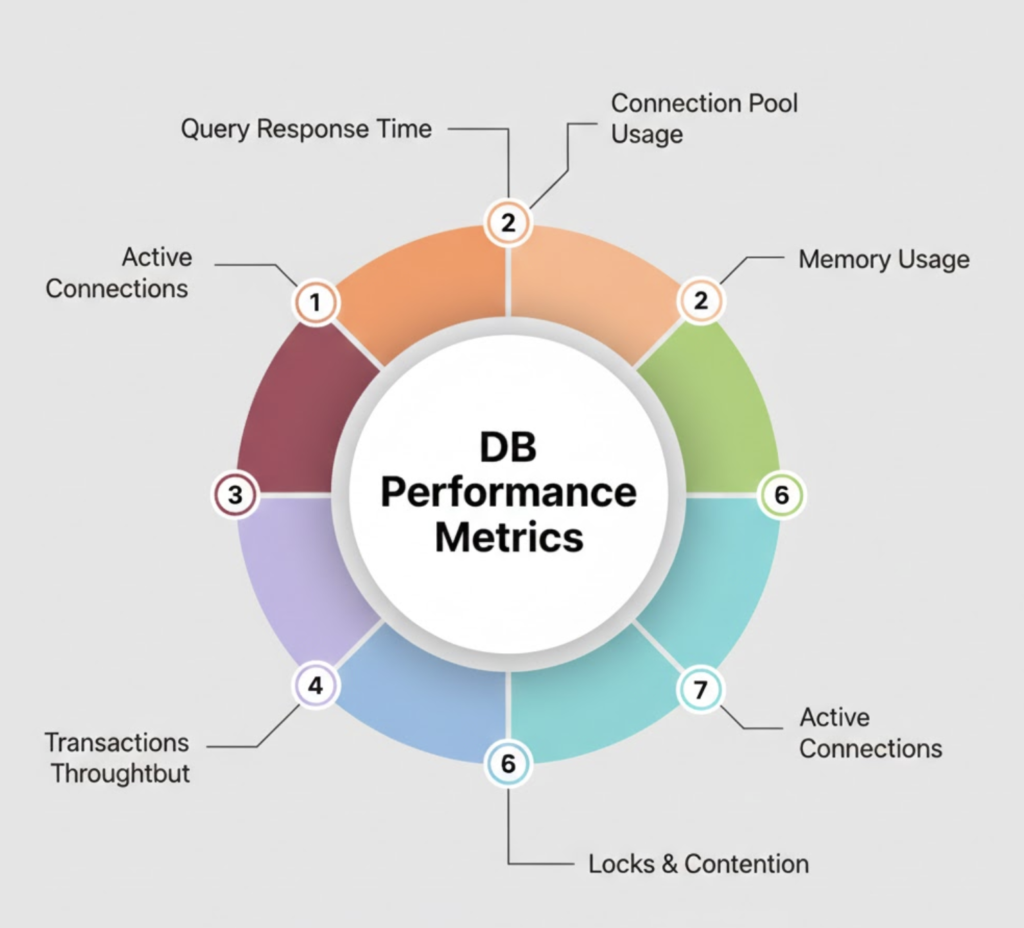
Key Database Performance Metrics
Monitoring the right metrics helps identify issues early:
- Query latency
- Throughput (reads/writes per second)
- CPU and memory usage
- Disk I/O and storage growth
- Connection counts
Monitoring and Observability
Effective monitoring includes:
- Real-time metrics dashboards
- Slow query logging
- Alerting on thresholds
- Historical trend analysis
This allows teams to detect degradation before it impacts users.
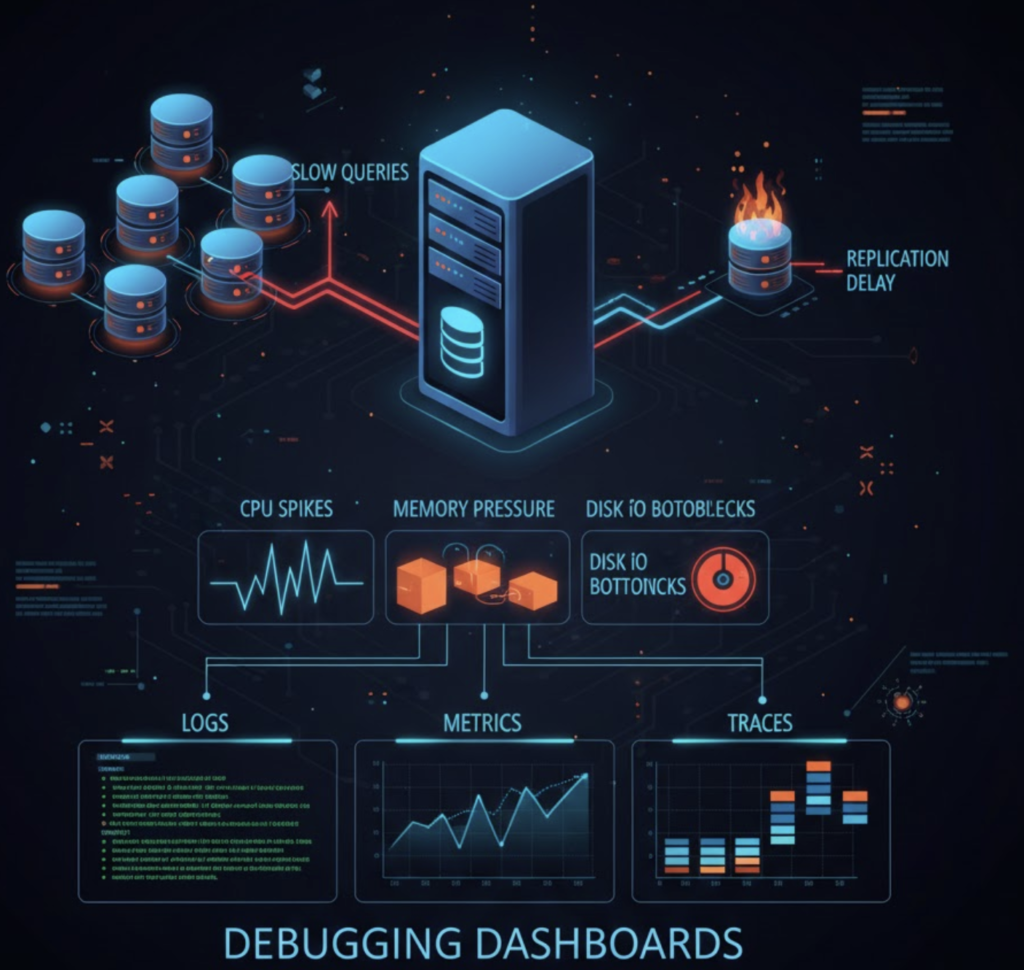
Common Performance Bottlenecks
- Missing or inefficient indexes
- Long-running queries
- Lock contention
- Insufficient memory
- Disk I/O saturation
Identifying the root cause is more important than applying generic tuning.
Database Optimization Best Practices
- Optimize queries and indexes
- Right-size hardware and resources
- Archive or purge old data
- Use caching where appropriate
- Regularly review execution plans
Operational Best Practices
- Automate backups and maintenance
- Test performance after schema changes
- Monitor growth trends
- Maintain clear runbooks
- Review incidents and apply improvements
Practical Examples of Database Performance Monitoring
Example 1: Identifying a Slow Query (MySQL / PostgreSQL)
Scenario:
Users report that the application dashboard loads slowly during peak hours.
Action:
Enable and inspect slow query logs.
MySQL
SET GLOBAL slow_query_log = 'ON';
SET GLOBAL long_query_time = 2;
Check slow queries:
SELECT * FROM mysql.slow_log ORDER BY query_time DESC LIMIT 5;
PostgreSQL
log_min_duration_statement = 2000
Outcome:
You discover a query scanning millions of rows due to a missing index.
Query Optimization Example
Example 2: Optimizing a Slow SELECT Query
Before Optimization
SELECT * FROM orders WHERE customer_id = 1024;
Problem:
- Full table scan
- High CPU usage
Solution: Add an Index
CREATE INDEX idx_orders_customer_id ON orders(customer_id);
Result:
- Query execution time reduced from seconds to milliseconds
- CPU usage normalized
Monitoring Metrics Example
Example 3: Detecting Resource Bottlenecks
Observed Metrics:
- CPU usage: 95%
- Disk I/O wait: High
- Query latency: Increasing
Root Cause:
- Database running on undersized VM
- Too many concurrent connections
Fixes Applied:
- Increased RAM
- Limited max connections
- Added connection pooling
Outcome:
Stable performance even during peak traffic.
Replication Lag Example
Example 4: Replication Delay in Production
Scenario:
Read replicas show stale data.
Check Replication Lag
MySQL
SHOW SLAVE STATUS\G
PostgreSQL
SELECT now() - pg_last_xact_replay_timestamp();
Root Cause:
- Long-running write transactions on primary
Solution:
- Optimized write-heavy queries
- Reduced transaction size
Caching Example (Redis + Database)
Example 5: Reducing Database Load with Caching
Problem:
Frequent reads for the same data (user profiles).
Solution:
Cache data in Redis.
Flow:
- Check Redis cache
- If cache miss → query database
- Store result in Redis
Result:
- Database read load reduced by ~60%
- Faster response times
Alerting Example
Example 6: Proactive Alerting
Set alerts for:
- CPU > 80% for 5 minutes
- Disk usage > 75%
- Replication lag > 30 seconds
Benefit:
Issues are detected before users are impacted.
Conclusion
Strong database performance is the result of good design, continuous monitoring, and disciplined operations. Applying best practices consistently helps maintain reliability as systems scale.