The ELK Stack is a powerful centralized logging and visualization solution used by DevOps engineers, system administrators, and SRE teams to collect, search, analyze, and visualize logs in real time.
ELK =
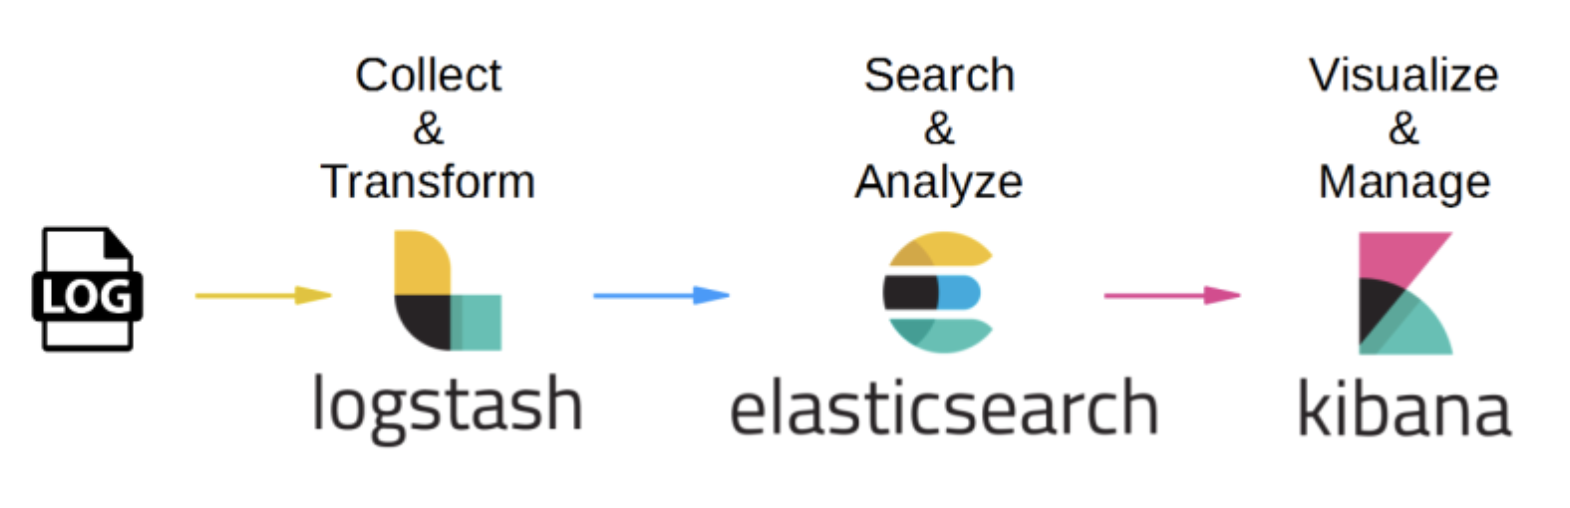
- Elasticsearch – Storage & search engine
- Logstash – Log processing pipeline
- Kibana – Data visualization dashboard
Server Logs → Filebeat → Logstash → Elasticsearch → Kibanayou’ll learn how to install and configure ELK Stack on Ubuntu Server from scratch, and visualize logs using Kibana.
Why Use ELK Stack?
✔ Centralized log management
✔ Real-time log analysis
✔ Powerful search & filtering
✔ Visual dashboards & alerts
✔ Widely used in production environments
ELK Stack Architecture Overview

Flow:
Server Logs → Filebeat → Logstash → Elasticsearch → Kibana
System Requirements
| Component | Requirement |
|---|---|
| OS | Ubuntu 20.04 / 22.04 |
| RAM | Minimum 4 GB |
| CPU | 2 Core |
| Java | OpenJDK 17 |
| User | sudo privileges |
Step 1: Update Ubuntu Server
sudo apt update && sudo apt upgrade -y
Step 2: Install Java (Required for Elasticsearch)
sudo apt install openjdk-17-jdk -y
java -version
Step 3: Add Elastic Repository
curl -fsSL https://artifacts.elastic.co/GPG-KEY-elasticsearch | sudo gpg --dearmor -o /usr/share/keyrings/elastic.gpg
echo "deb [signed-by=/usr/share/keyrings/elastic.gpg] https://artifacts.elastic.co/packages/8.x/apt stable main" \
| sudo tee /etc/apt/sources.list.d/elastic-8.x.list
sudo apt update
Step 4: Install Elasticsearch
sudo apt install elasticsearch -y
Configure Elasticsearch
sudo nano /etc/elasticsearch/elasticsearch.yml
Modify:
network.host: 0.0.0.0
http.port: 9200
discovery.type: single-node
Start Elasticsearch:
sudo systemctl enable elasticsearch
sudo systemctl start elasticsearch
Verify:
curl http://localhost:9200
Step 5: Install Logstash
sudo apt install logstash -y
Create Logstash Pipeline
sudo nano /etc/logstash/conf.d/syslog.conf
input {
  beats {
    port => 5044
  }
}

filter {
  grok {
    match => { "message" => "%{SYSLOGBASE}" }
  }
}

output {
  elasticsearch {
    hosts => ["http://localhost:9200"]
    index => "syslog-%{+YYYY.MM.dd}"
  }
}
Start Logstash:
sudo systemctl enable logstash
sudo systemctl start logstash
Step 6: Install Kibana
sudo apt install kibana -y
Edit configuration:
sudo nano /etc/kibana/kibana.yml
server.port: 5601
server.host: "0.0.0.0"
elasticsearch.hosts: ["http://localhost:9200"]
Start Kibana:
sudo systemctl enable kibana
sudo systemctl start kibana
Access Kibana:
http://<server-ip>:5601
Step 7: Install Filebeat (Log Shipper)
sudo apt install filebeat -y
Enable system logs:
sudo filebeat modules enable system
Edit Filebeat config:
sudo nano /etc/filebeat/filebeat.yml
output.logstash:
  hosts: ["localhost:5044"]
Disable Elasticsearch output:
#output.elasticsearch:
Start Filebeat:
sudo systemctl enable filebeat
sudo systemctl start filebeat
Step 8: Verify Data Flow
Check indices:
curl http://localhost:9200/_cat/indices?v
You should see:
syslog-2026.01.31
Step 9: Create Index Pattern in Kibana
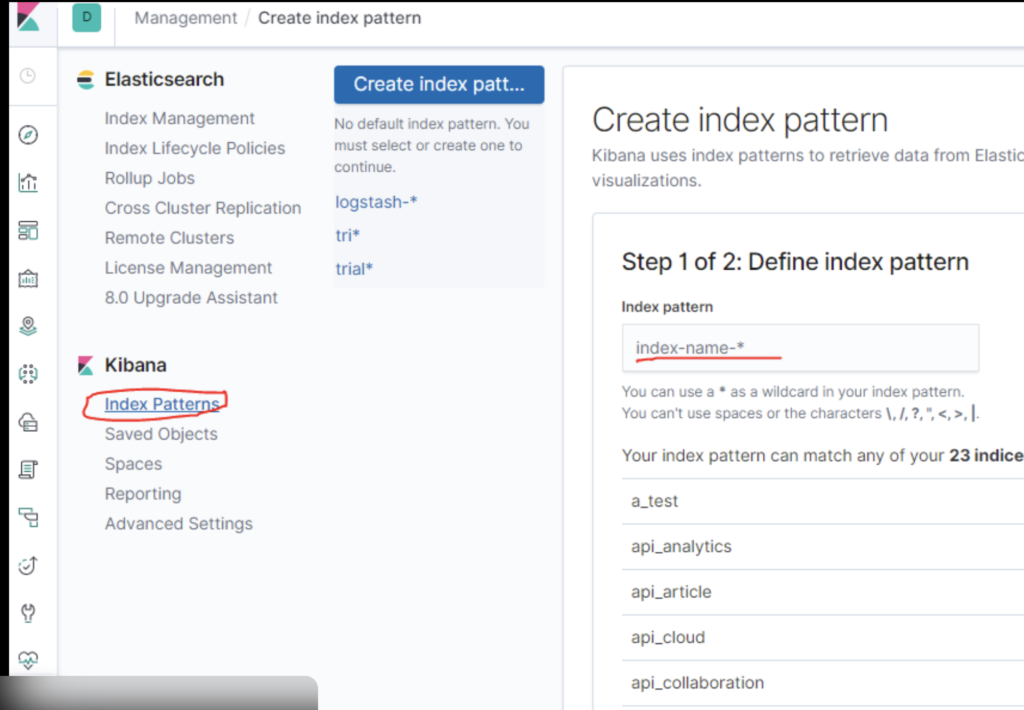
Steps:
- Open Kibana → Stack Management
- Go to Index Patterns
- Create index pattern:
syslog-* - Select
@timestamp
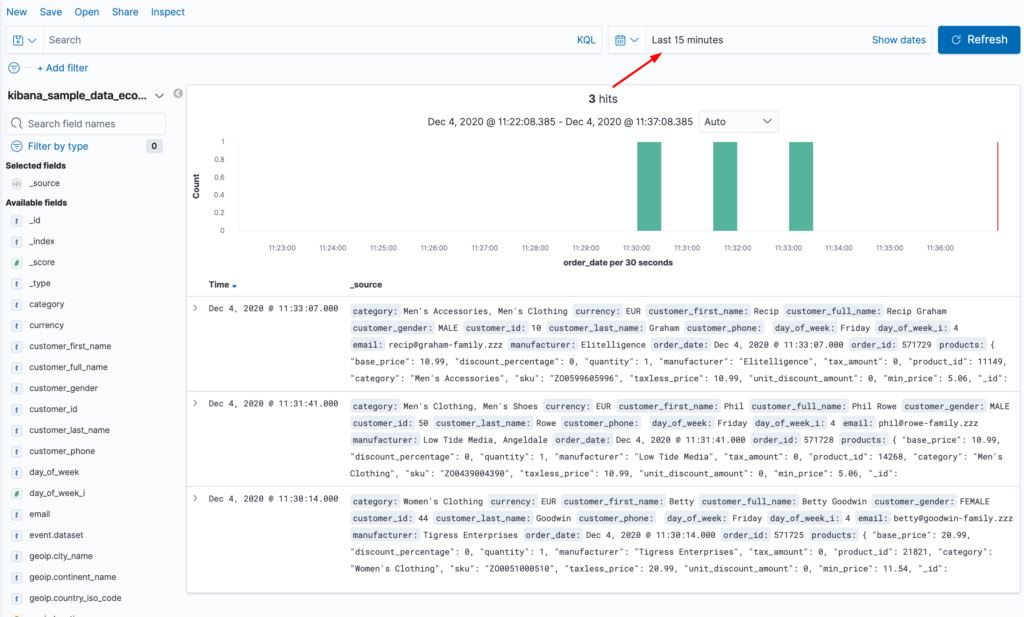
Step 10: Visualize Logs in Kibana
Common Visualizations
✔ Logs per host
✔ Error vs Info logs
✔ CPU & memory logs
✔ Authentication failures
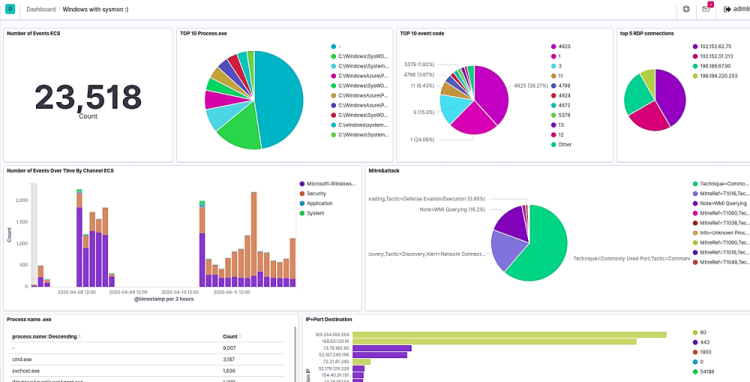
Create Dashboard
- Go to Visualize Library
- Add charts (bar, pie, line)
- Save to Dashboard
Security Best Practices (Production)
✔ Enable Elasticsearch security
✔ Use HTTPS & TLS
✔ Protect Kibana with Nginx + Basic Auth
✔ Use dedicated ELK server
✔ Enable index lifecycle management (ILM)
Common ELK Stack Issues
| Issue | Fix |
|---|---|
| Kibana not loading | Check port 5601 |
| No logs in Kibana | Check Filebeat → Logstash |
| High memory usage | Reduce JVM heap |
| Permission denied | Fix /var/log access |
Conclusion
The ELK Stack on Ubuntu Server provides a robust, scalable, and production-grade logging solution.
With Elasticsearch for search, Logstash for processing, and Kibana for visualization, you gain complete observability into your systems.
This setup is ideal for:
- Linux server monitoring
- Kubernetes logs
- Application debugging
- Security analysis